Lab Results may be viewed, graphed, and manually entered with the Vitals Lab Graph screen. A user may enter several labs at a time, or enter one-off results as well.
Note: A user may also set this as the default Vitals Clinical Marker view following these steps: User Setting: Table View
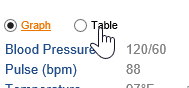
- Open the Vitals Clinical Marker screen from the Summary Timeline in the patient chart.
- Open the Table view in the upper left corner to view this as a flowsheet.
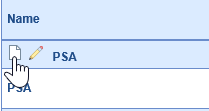
- To add a lab result for a specific lab, click the New icon to the left of the lab group.
- Set the date of the lab result and enter any appropriate values.
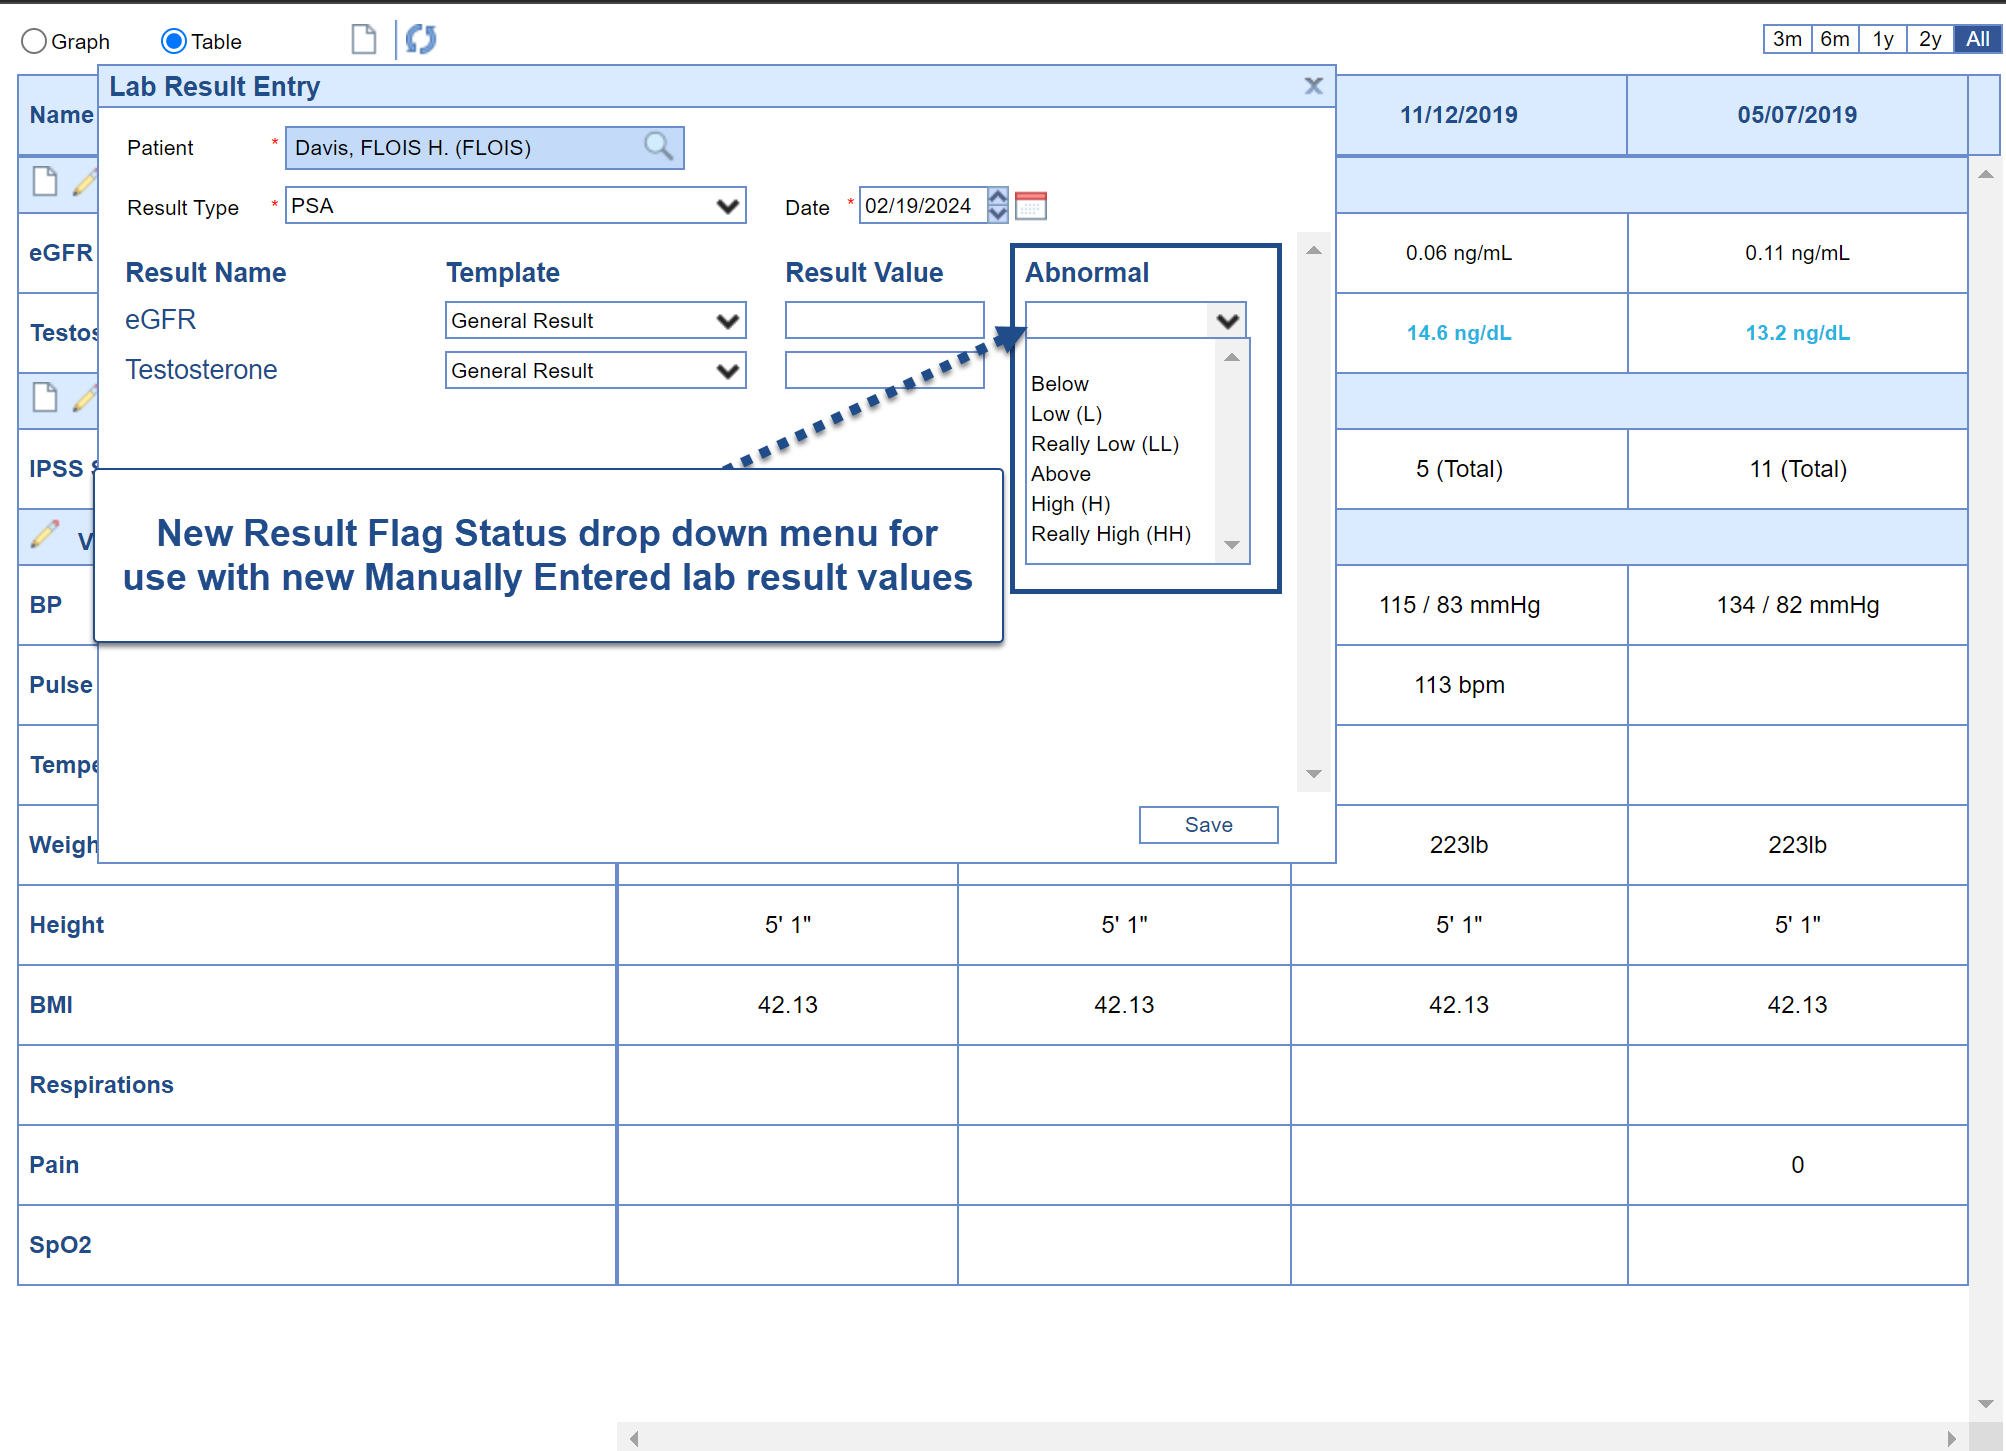
- Users can now set a Result Flag Status by choosing a flag from the available list. The default is blank - no flag - which displays in the standard system font as it always has, however, when setting a flag, the color display will follow the formatting as outlined in this article.
- Click Save for your entry in the lower right corner.
- Your data is saved - repeat step #4 above to continue entering labs for this lab group.


Lab Results may be viewed, graphed, and manually entered after scanning a paper lab result document from the eDocuments screen. A user may enter several labs at a time, or enter one-off results as well.
Note: A user may also set this as the default Vitals Clinical Marker view following these steps: User Setting: Table View
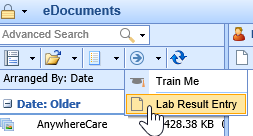
- After scanning a document, open the Lab Result Entry screen from the More dropdown menu.
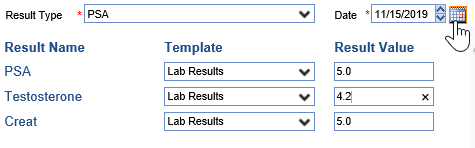
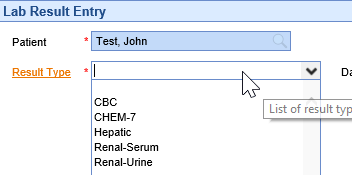
- Choose the lab grouping from the result type dropdown to choose what lab values to enter.
- Set the date of the lab result and enter any appropriate values.
- Click Save for your entry in the lower right corner.
- Your data is saved - repeat step #4 above to continue entering labs for this lab group.


For practices that have mapped data for both lab results and documents, the trickle import tool can be used to manually import documents or labs for a patient if these have not been automatically loaded.
Steps:
- Open the Patient Setup with the Index Card.
- Select the More option from the Index Card.

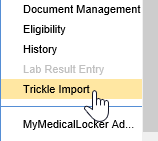
- Select the Trickle Import option from the dropdown menu.
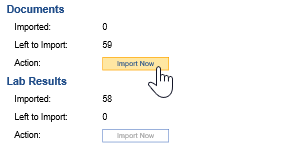
- You will now see the import screen. You will see the number of imported documents and documents available to import. Click the Import Now button to load the documents.


To improve visibility of lab result values that are flagged as out-of-range or abnormal, we are carrying through the color coding we currently use in the AMP Result category (which displays those flagged values in red font). We are also expanding the display to allow users to distinguish between abnormal high and low values based on the Result Flag - where flags L, LL, or Below will display in a blue font, and then all other abnormal flagged results will continue to display in red font. Remaining values that are not flagged would continue to display in the standard system font.
Furthermore, we added the ability to mark-up new Manually Entered lab values to contain a Result Flag so that those lab values can also be displayed in blue font for values that are L, LL, or Below, or red font for all other Result Flag values selected (the default is blank - no flag - which displays in the standard system font). Use this link for how-to information on manually enter labs.
This color coded display will carry over from AMP Results to the Vitals > Table View, and will update the Result Requisition screen display to update the highlight for any results displayed in blue font because they are flagged with L, LL, or Below to highlight blue, while other flagged abnormal results would continue to display in red font highlight.
Note: By default, Show Abnormal Results in Blue setting will be turned on for all users. However, users can turn off the blue color font if they have difficulty for any reason. Turning off the blue color font would revert back to the existing (standard) RED font we currently use to notate lab result values that are flagged as out of range.
Default View of Result Data
As noted above, by default we are setting result data to display specified low abnormal flagged result values in blue font, other abnormal flagged result values in red font, and result data that is not flagged will continue to display in standard font. Examples that are shown below give an idea of what users can expect to see (although results will vary dependent on user settings in OfficeEMR and based on the users device).
EMR Patient AMP Results

Vitals Table View Results

Results in Requisition Display

SOAP Note (Progress Note) Data Trend Display
We will be carrying the result data color coding through to the Data Trends view in the SOAP Notes in our future release.

User Setting for Control Over Blue Font
The following options exist for user to turn off/on the blue formatting associated with Result Flags of L, LL, or Below:
Turn Off/On via User Settings:
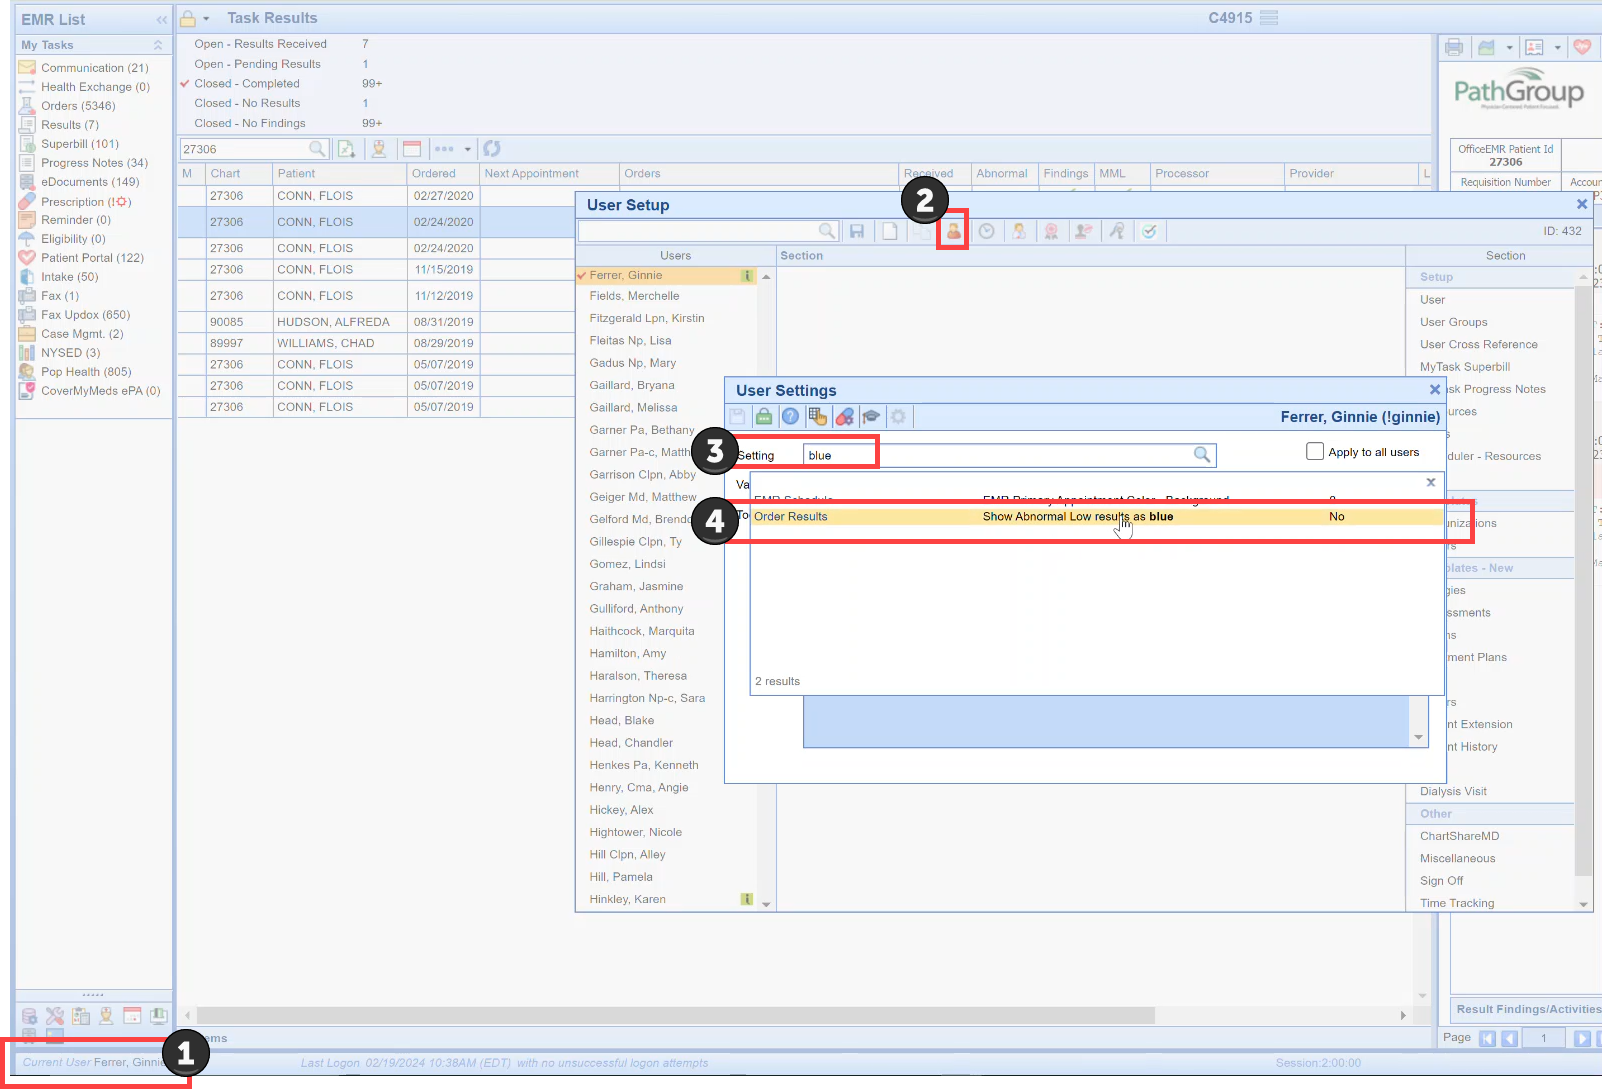
- Open your User Settings by clicking on your icon
- Choose User Settings
- Search any combination to open the setting Show Abnormal Low results as blue
- Select to open that setting (which defaults to check-marked to display low flagged values in blue font) - leave check marked for "Yes" to Show Abnormal Low results as blue, or uncheck for "No" to Show Abnormal Low results as blue

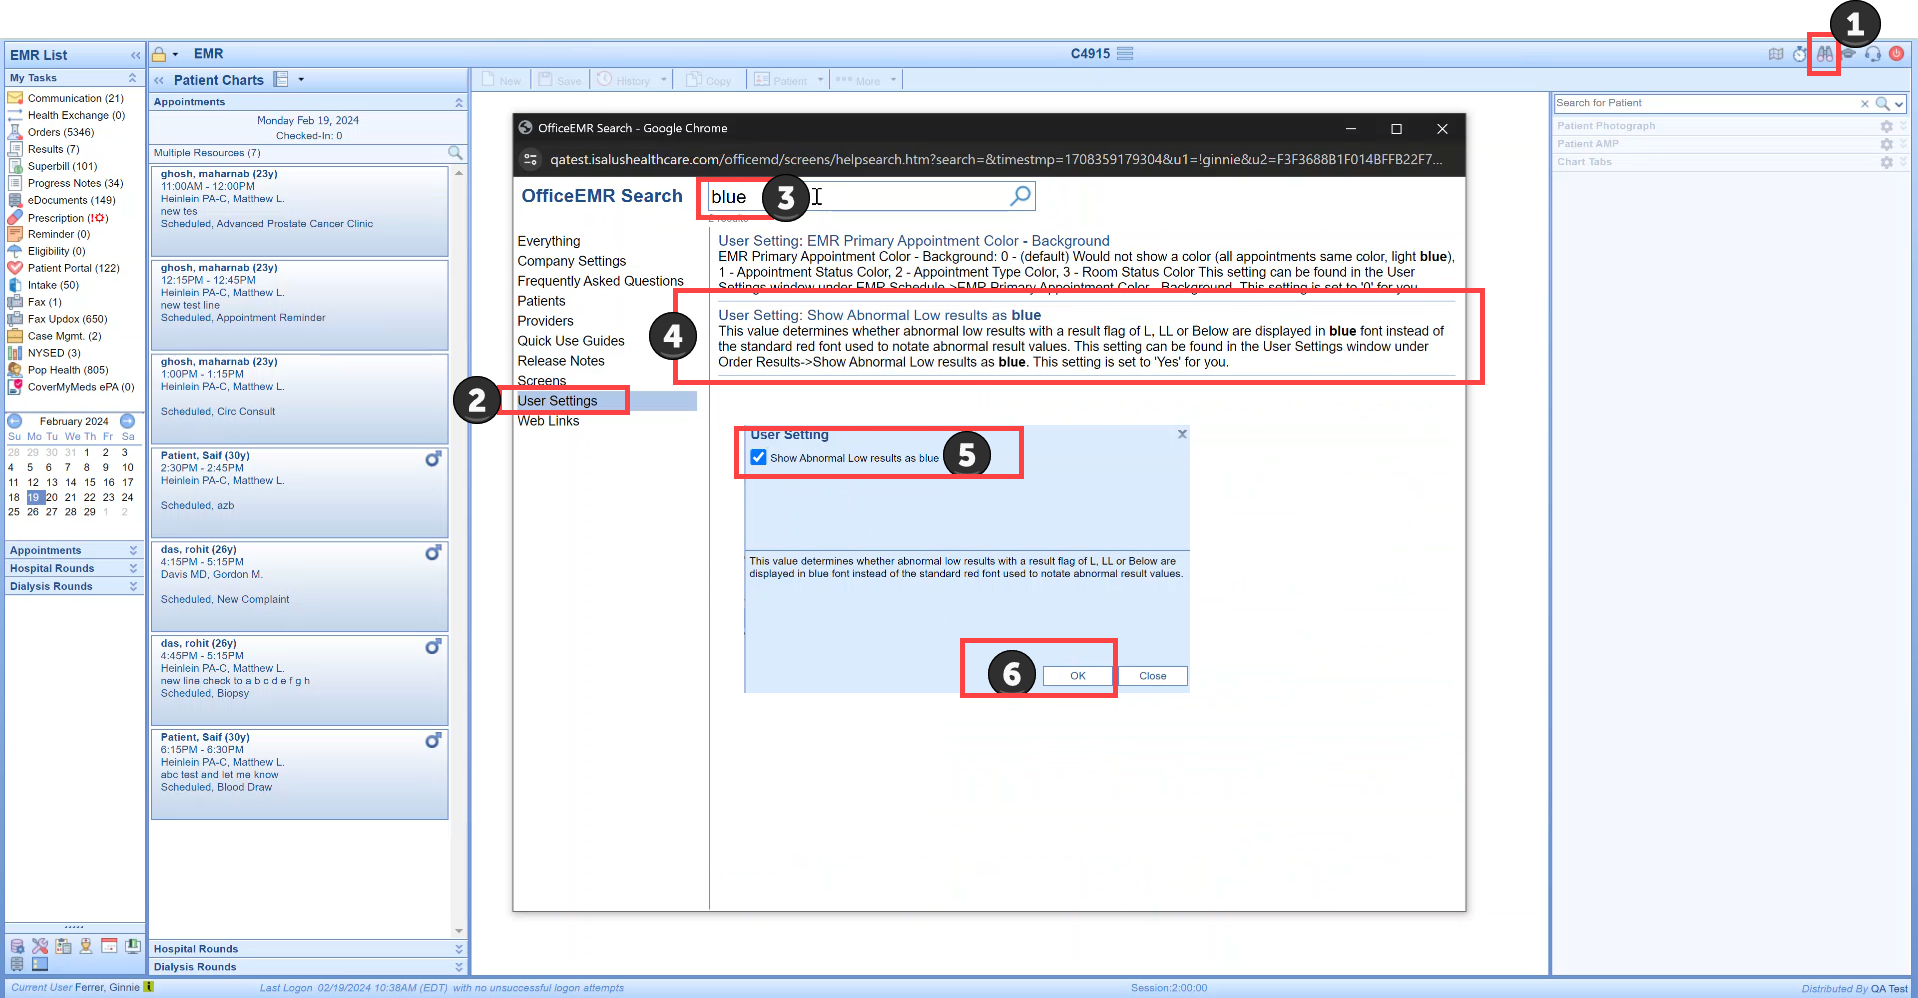
Turn Off/On via Office EMR Search icon:
- Open the Office EMR Search icon
- Choose User Settings
- Search any combination to open the setting Show Abnormal Low results as blue
- Select to open that setting (which defaults to check-marked to display low flagged values in blue font) - leave check marked for "Yes" to Show Abnormal Low results as blue, or uncheck for "No" to Show Abnormal Low results as blue

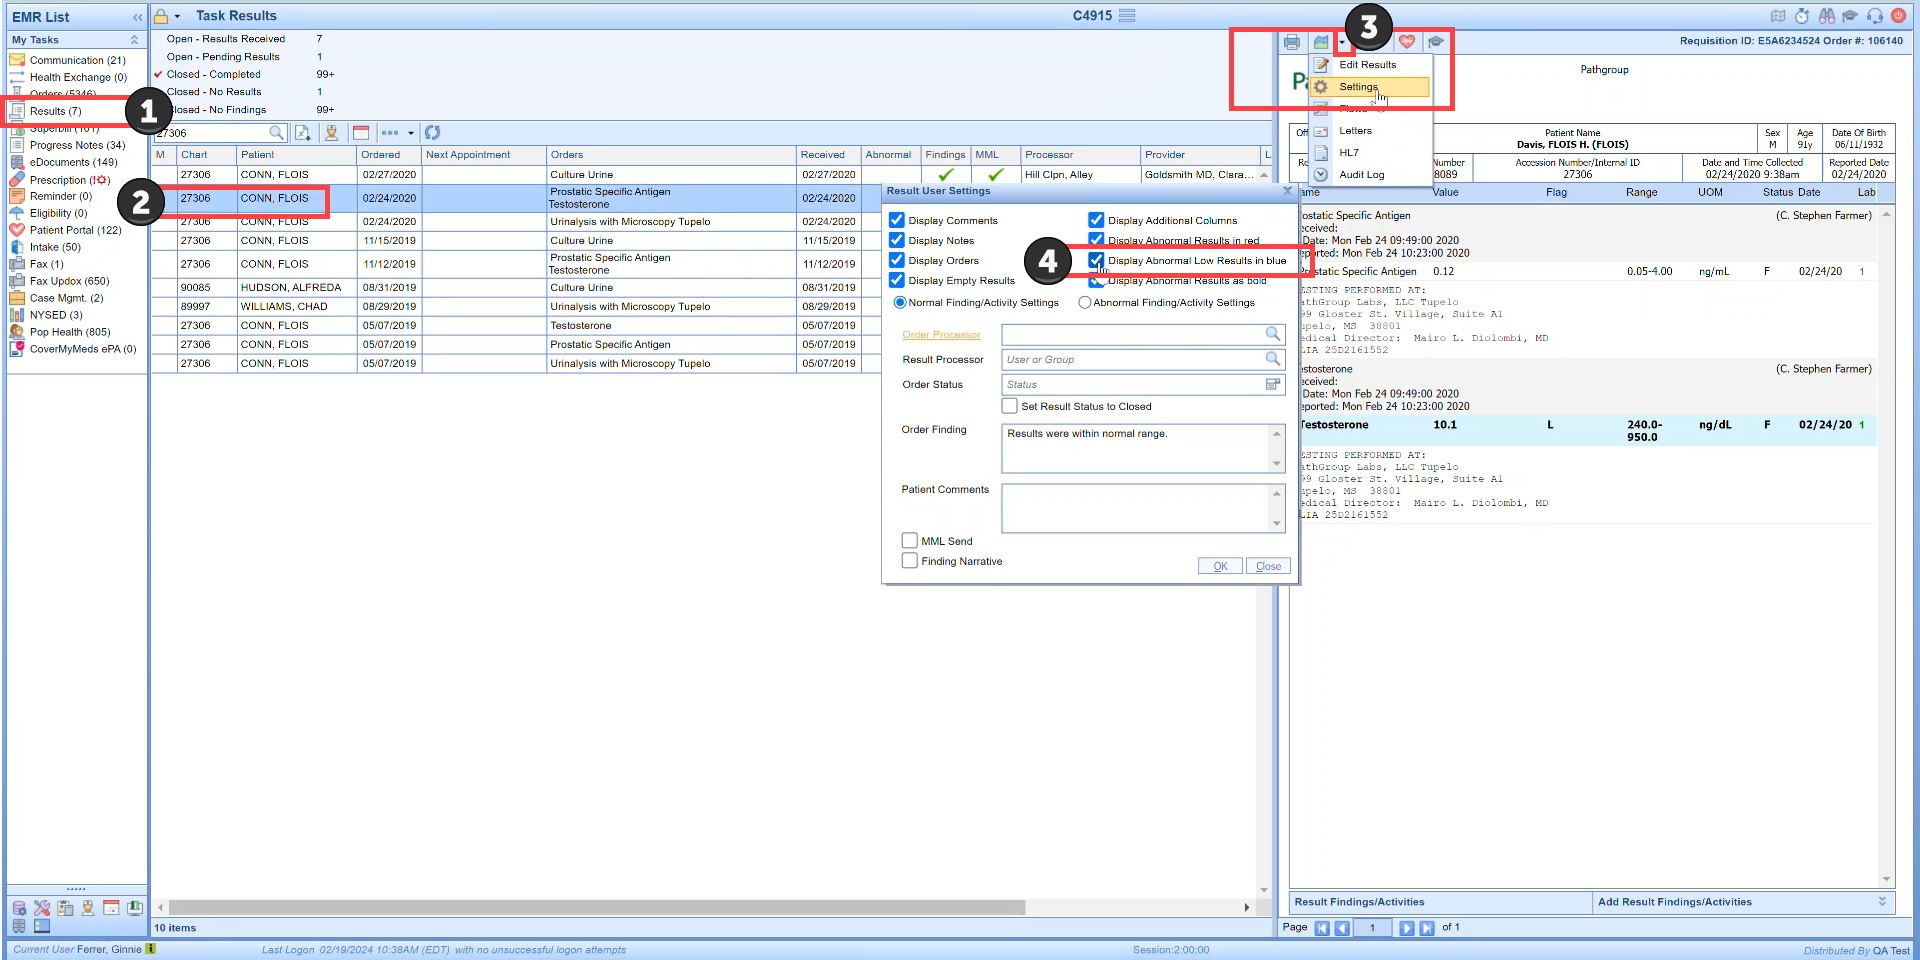
Turn Off/On via Result Options Settings when viewing a Result Requisition:
- Open the Result Requisition view from either My Tasks > Results, OR from the Patient Chart > Order Entry >Result tab
- Select any requisition (where you can see L, LL, or Below values is most ideal for visual display of blue or no blue)
- Use the Result Options drop down menu and select Settings
- Select to open that setting (which defaults to check-marked to display low flagged values in blue font) - leave check marked for "Yes" to Show Abnormal Low results as blue, or uncheck for "No" to Show Abnormal Low results as blue

Currently, when users link results using the unsolicited labs queue, they can unlink those results and the results will be moved back into the unsolicited queue. This functionality will remain exactly as it has been. Access steps to remove results using the unlink and return to unsolicited queue here. This process, however, is limited to the those order result items linked via the Unsolicited Labs queue.
In Release 24.105 we have added new functionality allow users (based on role assignment) to delete lab results from a patient chart. This removal is a permanent action that will delete all instances of the lab results based on the Requisition ID of the Result being viewed, and cannot be undone. When a result is deleted

Deleting Lab Results
Access to the action button to Delete Lab Results is driven by User Roles
First, a user must be assigned the role for EMR - Orders under Setup to Remove Lab From Patient Chart. This link directs you to information on Roles and Role Assignment.
With proper role assignment, if a user wants to permanently delete a lab order result, the user would have access to the Delete Result button by viewing an order lab result in:
My Tasks > Results

EMR > Patient Chart > Order Entry > Results tab > Open Result

When a user chooses delete they will encounter a warning that requires confirmation because this Delete action cannot be undone:
Clicking No or Cancel will exit the delete result process. Clicking Yes will permanently delete the result and related data - this action cannot be undone. 
Auditing for the deletion of an order result is found in Reports > Audit > Security reports and provides the user, date, time, requisition, and an entry for MML result deletion when that occurs.

Comparing the difference between use of the existing delete icon in the Unsolicited Labs process which is only accessible from Orders, and the New delete result action that permanently deletes any lab order result which is only accessible from Results:

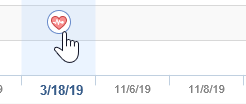
Currently, when users access the EMR and view the Patient's Timeline, the Lab icon tool-tip displays the short description for the first 5 lab orders when you hover over the Lab icon. The user has no idea if other lab tests were run and resulted, or if what they are seeing is everything. In Release 24.105 we have added new Company Setting that will allow users to deviate from this default.
Available for Beta currently - expected for full production in a 2024 Q2 release
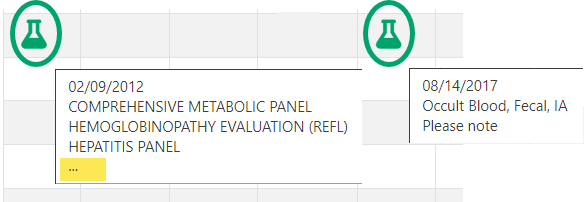
EMR Timeline Hover Text Updates available for clients using the (Beta) New EMR Timeline
In the New EMR Timeline when users hover over the Lab icon, the tool-tip will continue to display the first five short lab short description names as a default. However, users will notice that when there are other labs not displayed, they will see an ellipsis displayed as an indicator to the user that there are more lab tests that what is listed.
If a practice wants to adjust the default of displaying five lab text names to more or less, they can use the new company setting (noted below).

 New EMR Timeline Lab Tool-tip Display on hover
Company Setting
If your practice wants to display more than the default 5 tool-tip displays (lab short descriptions) when you hover over the Lab icon, then you will need practice users with the ability to access Company Settings would need to set the Company Setting: Timeline orders hover maximum display limit setting and designate their desired display. This link takes you to the Knowledge Owl articles for everything you need to know about Company Settings. The maximum that can be set to display is 100.

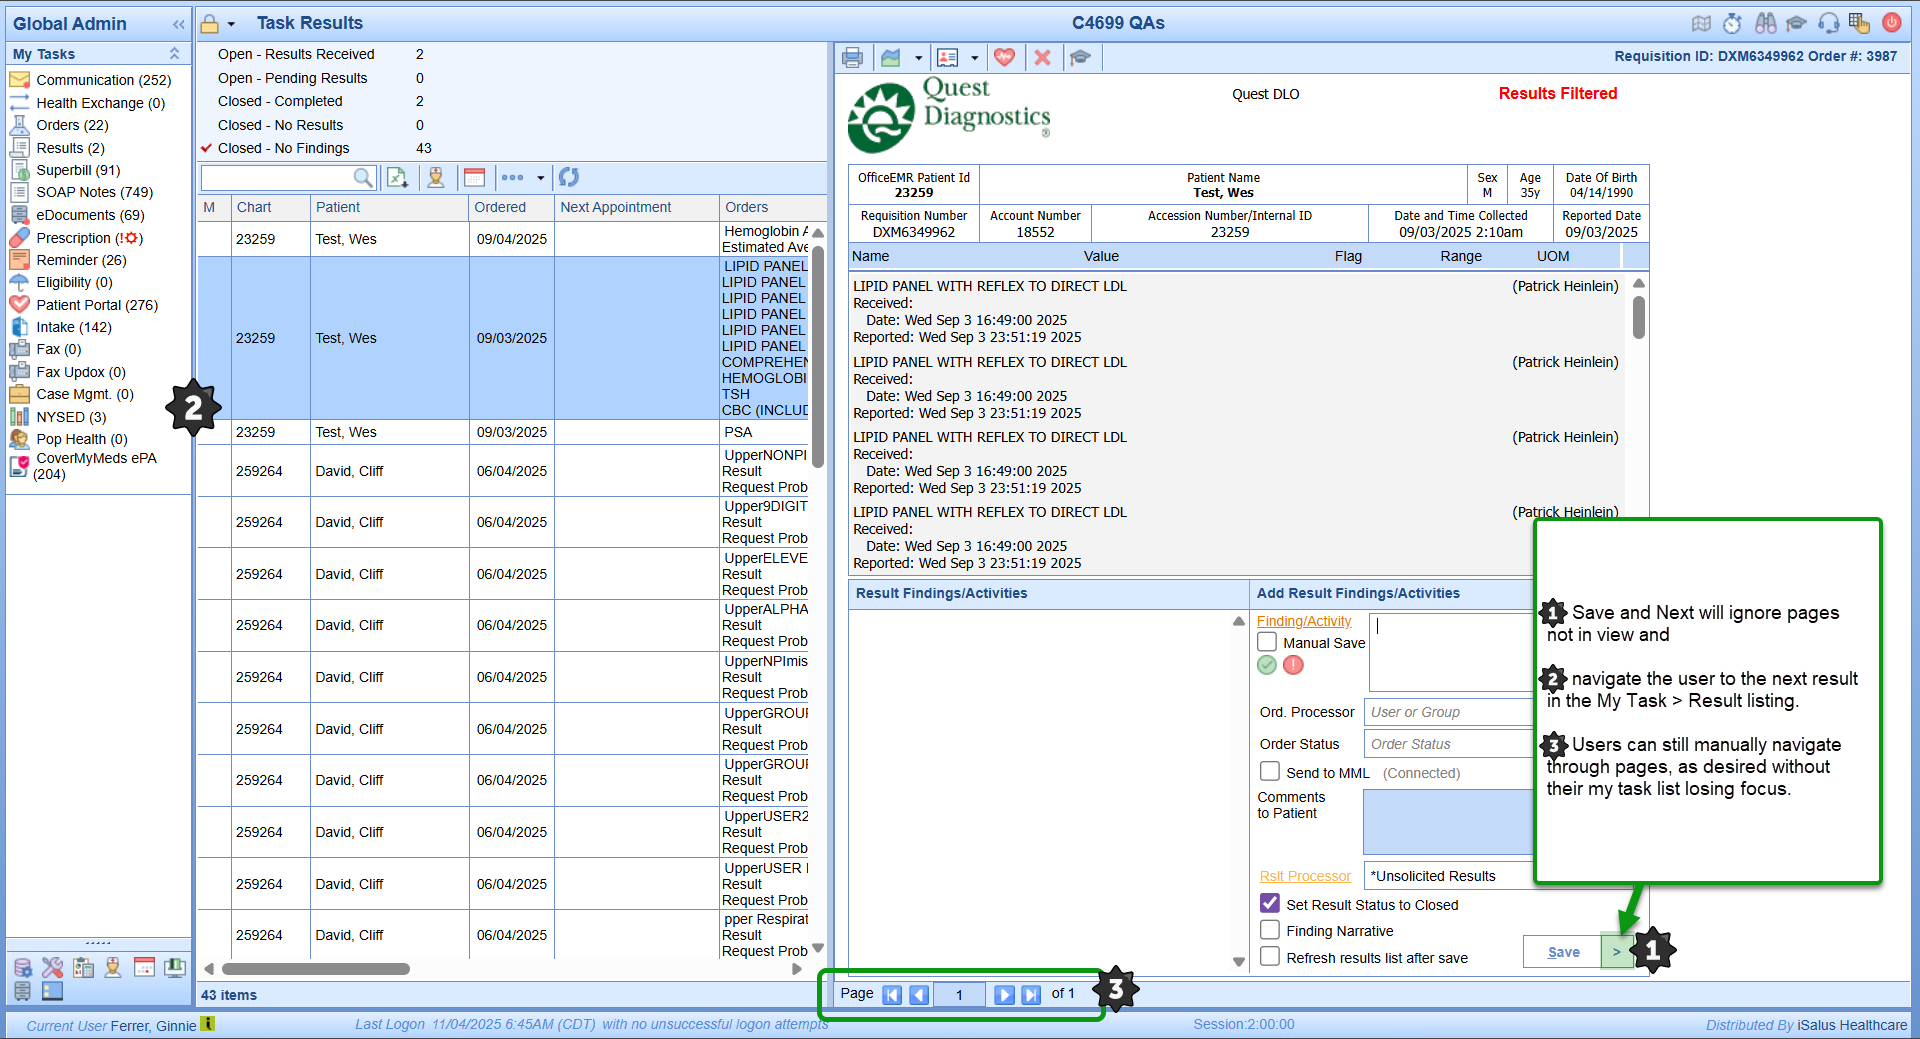
Save & Next no longer navigates the user through pages within the result in view but instead moves the user through the Task Results list in the left viewing pane.
Navigating Task Results with Save & Next
As of our 25.146 release (11/20/2025) the Save & Next button was updated to:
- Save the current result Findings & Activities
- Navigate to the next result in the Task Results listing to display the next result for processing
- Users can still view pages associated to the result in view using the manual navigation buttons (which doesn't affect the focus in the Task Results list)
Single Click Result Processing
The Single Click Result Processing feature introduced to streamline Result Findings and Activities workflow, allowing users to move through results more efficiently with fewer clicks, whether or not Single Click Auto Save is enabled.
For users with Single Click Auto Save & Next enabled, Normal and Abnormal results can still be processed automatically in one click, with the option to temporarily pause automation using the Manually Save checkbox when adjustments are needed.
When working from My Tasks > Results, completed findings continue to display the familiar check-mark indicator as users advance through results and pages. This update refines the user experience, maintaining existing functionality while reducing steps for faster, more consistent result processing.
User Settings to turn on Single Click Result Processing:
1. Determine if you want to set up this new functionality for Normal, Abnormal, or both types of results.
2. Access your user settings one of two ways:
a. User settings through the User Setup screen as outlined here:
i. Then search for and set up the following related user settings, as desired:

b. User settings in the Result User Settings window from any lab result requisition view:
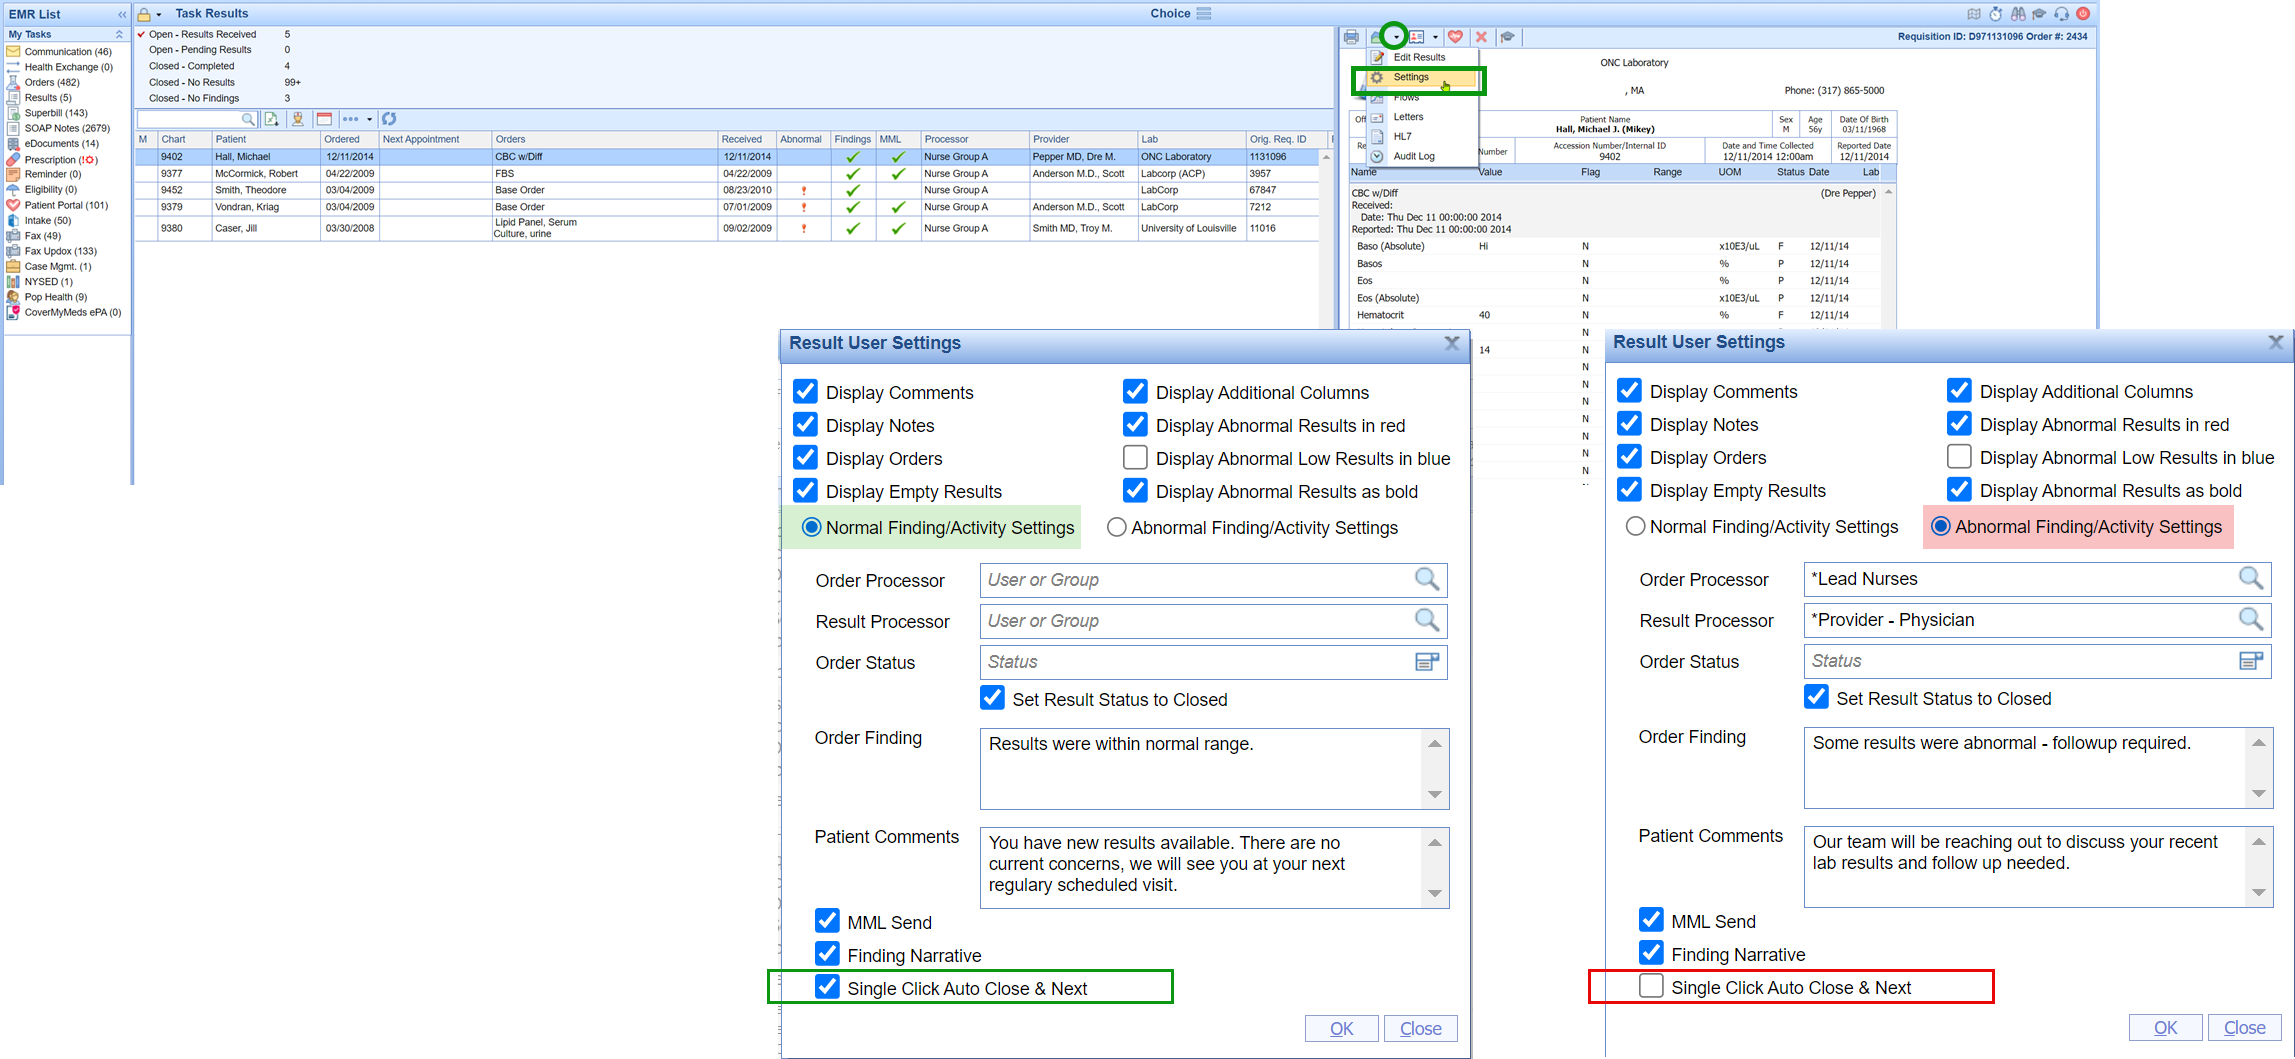
Open any Result requisition, click on the Result Option menu item drop down arrow and choose 'Settings'. In the Result User Settings screen you will notice that there is a new 'Single Click Auto Close & Next setting checkbox associated with Normal Finding/Activity Settings and Abnormal Finding/Activity Settings. Users can choose to turn on this new single click functionality for one, both, or none (based on their personal needs).
Notice in the example below, this user only set up Single Click Result Processing for the Normal Findings/Activity Settings default...

3. Once you have chosen to turn on either of the user settings shown in step 2 above, you will need to follow the Single Click Result Processing Workflow noted in the next section.
Single Click Result Processing Workflow:
Single Click Result Processing, once turned on by a user, works the same regardless of where the user opens the Result Requisition and accesses their Green Checkmark icon for Normal findings or the Red Exclamation icon for Abnormal findings. At any time the user needs to pause the automated processing that occurs with Single Click Result Processing, they will just need to click to check mark the Manual Save checkbox.
Processing a lab with Single Click Result Processing turned on for your user account:
1. Access the Result Requisition.
2. Review the result data to determine your findings, most importantly, know if you need to override your Normal or Abnormal Defaults.
3. Once you know the Normal/Abnormal finding, you have two processing options: unchecked manual for auto-processing OR override auto-processing by checking ‘Manual Save’ in those cases where you want to add additional content to your Result Findings:
a. Green Checkmark for Normal Findings.
b. Red Exclamation icon for Abnormal Findings.

Note: The Manually Save option only appears when the Single Click Auto Save & Next feature is enabled. Users who enable the feature for only one result type (Normal or Abnormal) should be mindful of which will auto-process.
In case of accidental processing, users can easily access the result, engage the "Manually Save" checkbox, then input the updated Findings/Activities, and then use the save button to complete the update.
