In a Billing Analytics workbook, users often need to change the filters for multiple pivot tables or charts at once -- most frequently when updating date ranges to a new value. Rather than add a date filter to each chart or table, it's more efficient to add a slicer that connects to each to perform the filter.
To add a slicer to your worksheet, perform the following steps:
- Decide where you'll want the slicer. Frequently I have a sheet at the beginning of my workbook where I can put all relevant slicers.
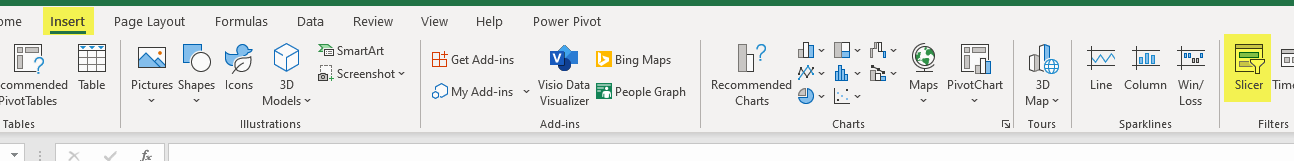
- On the Excel toolbar, select Insert, then Slicer:
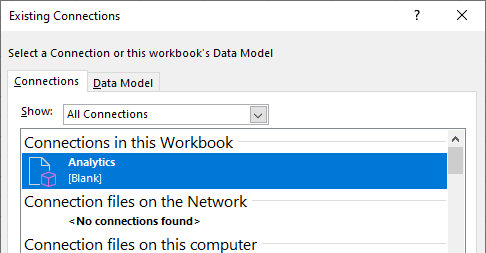
- Select your Billing Analytics connection, and hit OK:
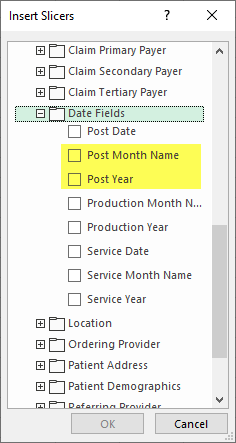
- Select the fields you want to slice, and hit OK. In this example, I want to slice on Post Year and Post Month (Note: If slicing on dates, we recommend using the fields under the Date Fields category rather than the hierarchies at the top of the list):
- This will bring up your slicers -- arrange them on the page as desired.
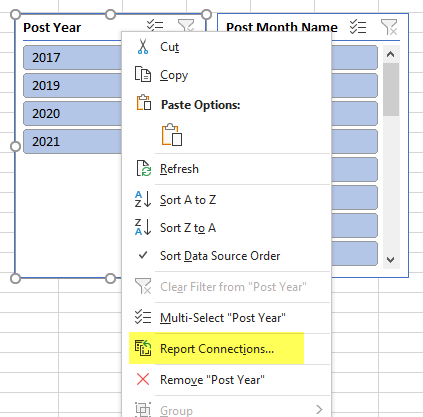
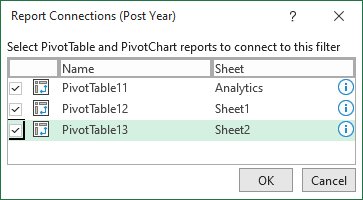
- Right-click on each slicer, and select Report Connections:
- Select all report items you'd like to connect the slicer to, and hit OK.
- If at any point you need to add additional PivotTables or PivotCharts, you can repeat steps 6 and 7 to connect them to the slicer.


