Here are a few examples of reports that can be created with the new Billing Analytics.
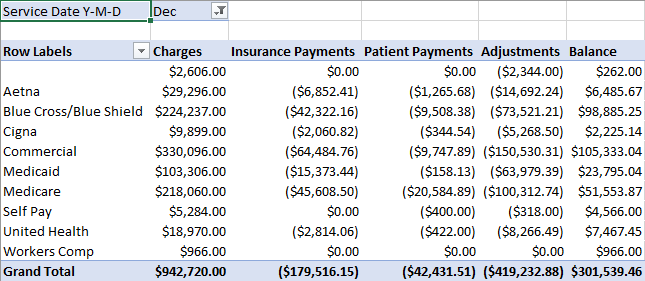
Financials by Insurance Class for DOS Month
This report shows Charges, Payments, Adjustments, and remaining Balances for everything with a DOS month in December, grouped by Insurance Class.
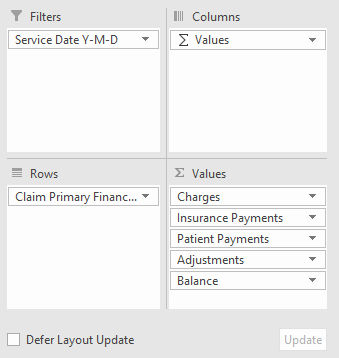
- First, drag the desired fields to the PivotTable areas. Please note that 'Values' is not a field that you need to add to the Columns area -- it's automatically populated if more than one measure is added to the Values section, to denote that you'll have columns associated with each value.
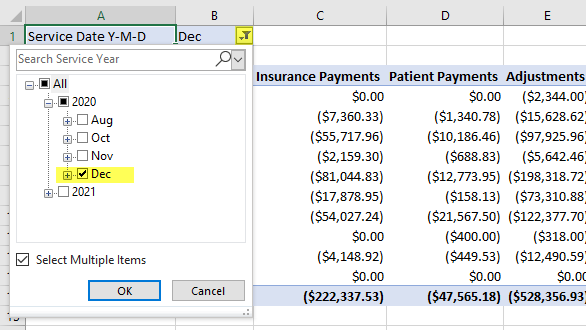
- Next, apply the desired service date filter by clicking on the filter icon where the filter is listed at the top of the report:
- You can now see the desired output, filtered to the desired date of service month:


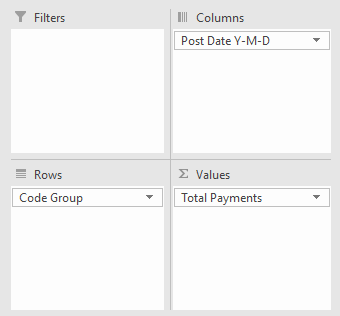
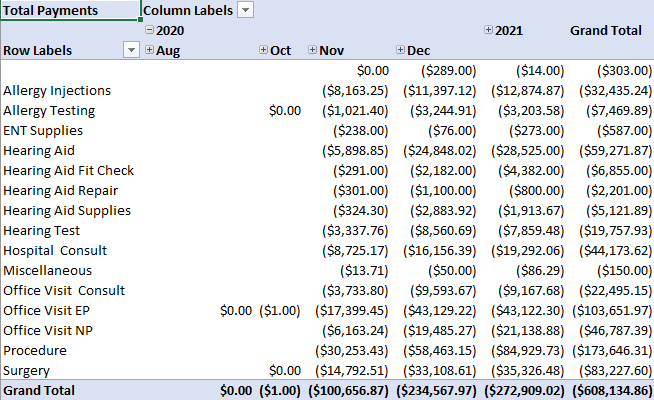
Total Payments by CPT Group Over Time
- First, drag the desired fields to the PivotTable areas:
- You can now see the desired output, payments by CPT Group over time. The years in the column headers can be expanded with the (+) icons to view information for months and days.


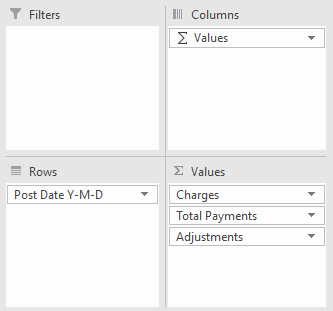
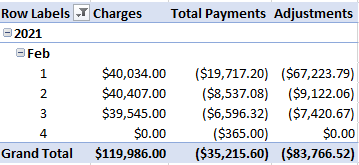
MTD Charges, Payments, and Adjustments
- First, drag the desired fields to the PivotTable areas. Please note that 'Values' is not a field that you need to add to the Columns area -- it's automatically populated if more than one measure is added to the Values section, to denote that you'll have columns associated with each value.
- You can now see the desired output, MTD Charges, Payments, and Adjustments. Please note that if you ever want to hide a component of the date field (the year, for instance, in the example below), you can right-click the year, go to 'Show/Hide Fields,' and uncheck the year field.


Refund Report
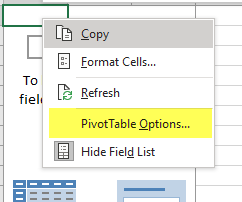
- First, we'll change the format of our PivotTable. Right-click on the table and select PivotTable Options:
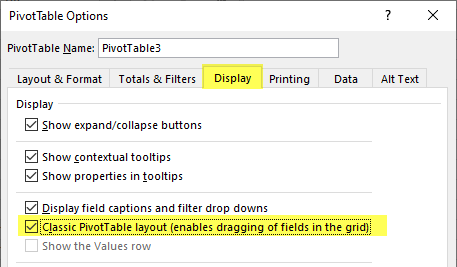
- On the Display tab, select the Classic PivotTable layout, and hit OK:
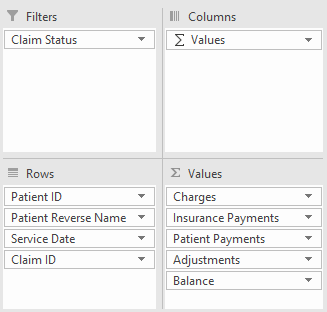
- Drag the desired fields to the PivotTable areas. Claim Status, Service Date, and Claim ID can be found in the Claim Information folder, Patient ID and Patient Reverse name are in Patient Demographics, and all the values are in the measures at the top of the window. Please note that 'Values' is not a field that you need to add to the Columns area -- it's automatically populated if more than one measure is added to the Values section, to denote that you'll have columns associated with each value.
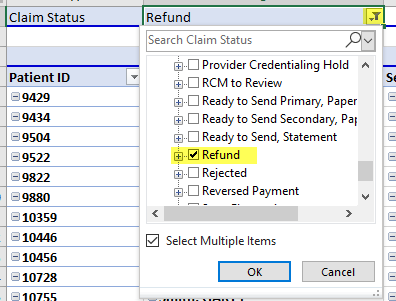
- Next, apply the desired Claim Status filter by clicking on the filter icon where the filter is listed at the top of the report:
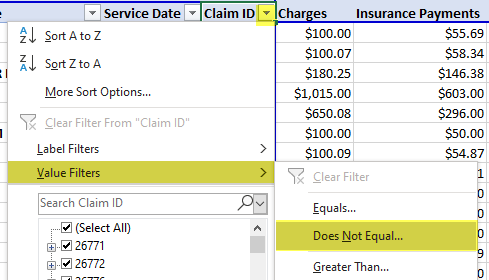
- If you see zero balance or actual balance claims on this list, you can go into the system and correct them. However, if you'd like to exclude claims where the balance is zero (or greater than zero), you can apply a value filter. Select the drop-down next to Claim ID, select Value Filter, and choose the relevant comparison:
Enter the desired logic, and hit OK: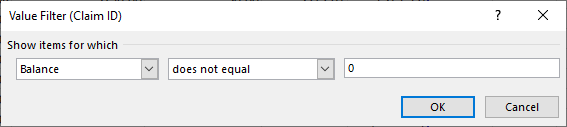
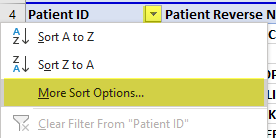
- If you would like to order patients from largest credit balance to least, click the drop-down beside the Patient ID, and select More Sort Options:
Choose Ascending by and Balance, and select OK: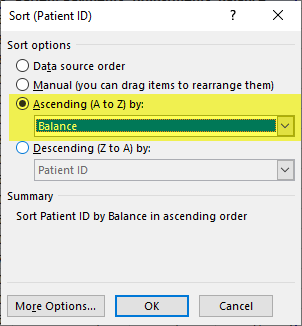
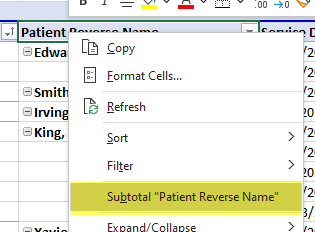
- If desired, you can sub-total by patient. Right-click on the column header Patient Reverse Name, and click Subtotal "Patient Reverse Name":
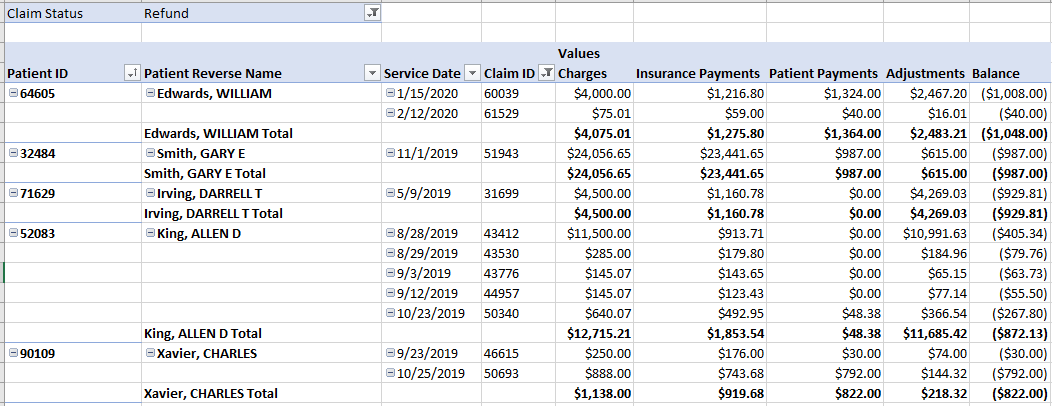
- You can now see a list of your Refund status claims, grouped by patient and ordered by the patient with the highest total credit:


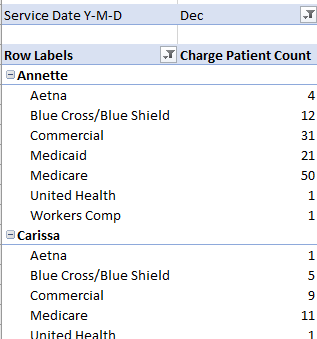
Distinct Patients Seen in DOS Month, by Rendering Provider by Insurance Class
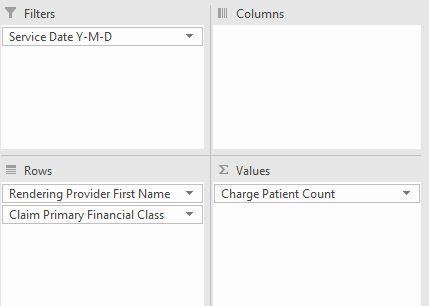
- First, drag the desired fields to the PivotTable areas.
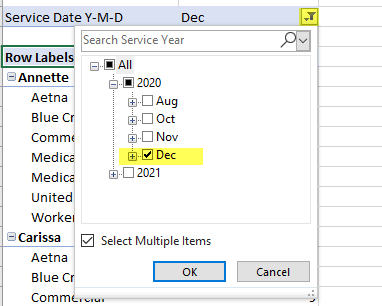
- Next, apply the desired service date filter by clicking on the filter icon where the filter is listed at the top of the report:
- You can now see the desired output, Distinct Patients Seen in DOS Month by Rendering Provider by Insurance Class: