Here are a few examples of reports that can be created with the new Billing Analytics.
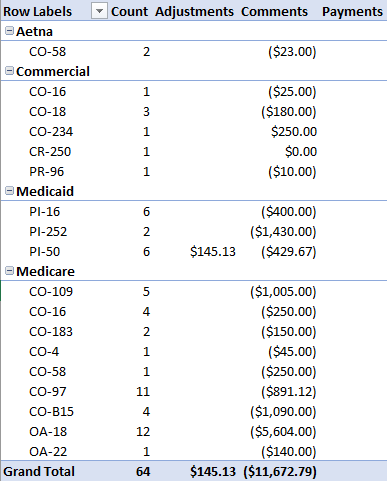
Denials by Payer by Class for Post Month
This report shows denial counts, adjustment amount, comment amount, and payment amount for CARCs posted over a certain range, grouped by Deposit Payer Financial Class and CARC Code.
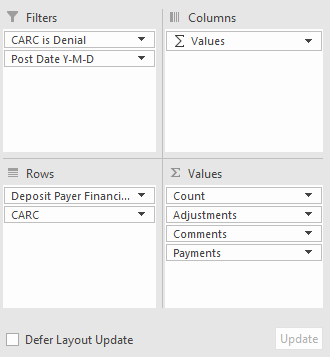
- First, drag the desired fields to the PivotTable areas. Please note that 'Values' is not a field that you need to add to the Columns area -- it's automatically populated if more than one measure is added to the Values section, to denote that you'll have columns associated with each value.
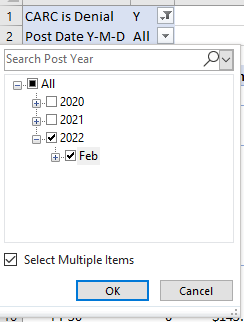
- Next, apply the desired post date filter by clicking on the filter icon where the filter is listed at the top of the report. I also filtered to see only where CARC is Denial is "Y", so that I'm only looking at denials and not my contractual adjustments like CO-45's.
- You can now see the desired output, filtered to the desired post date month:


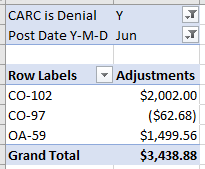
Denial Codes Adjusted
- First, drag the desired fields to the PivotTable areas:
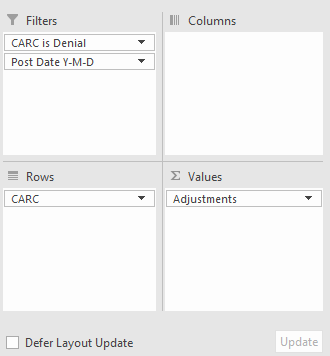
- Next, apply the desired post date filter by clicking on the filter icon where the filter is listed at the top of the report. I also filtered to see only where CARC is Denial is "Y", so that I'm only looking at denials and not my contractual adjustments like CO-45's.
You can now see the desired output, actual adjustment amounts for different CARCs. You can see in the below that CO-102's and OA-59's are reversals of adjustments, with a positive value. However, it does show that CO-97's have an actual adjustment against a balance -- that dollar amount can be double-clicked to explore further.