The Vitals clinical marker will be added to the timeline whenever a new vital record is saved in the Vitals chart tab. While the information is originally triggered by a new vital record, a large amount of information can be viewed in the Vitals Trends screen.
Graph View
When the Vitals Clinical Marker is selected, the Graph View will be displayed. This allows a user to visualize changes to vitals, lab results, procedures, and medications over a period of time.
- Users can click on the Vitals or Lab Result data points within the screen to add the values to the graph.
- Users can filter the data by time range
- Users can customize the screen to meet their unique needs

Customize the Vitals List
If you would like to change the order or decide which options are available to you within the list of Vitals section in the upper left, follow these steps:
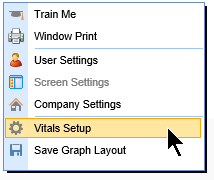
- Right click over the window
- Select Vitals Setup
- Use the arrows to move items up or down in the list. Use the Enabled indicator to turn items on or off.
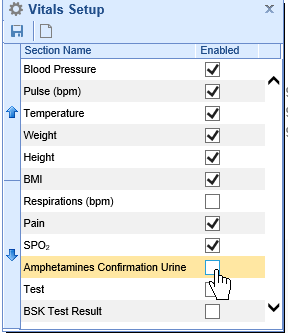
- Use the New button to add custom data points to the list. NOTE: Please contact iSalus Support for this.
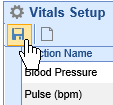
- Click Save


Customize the Procedures List
Users can choose to have procedures that are billed for in the office to be added to the timeline. This is done by pulling in specific CPT codes from the billing system. This is setup as both a Company and a User Setting.
User Setting: Procedure List for Vitals Timeline Wireframe Summary
Company Setting: Procedure List for Vitals Timeline Wireframe Summary
Customize the Lab Results List
Users can choose to have a list of lab results groupings added to the timeline. This is done by pulling in electronic or hand-entered lab result values from across the application. The exact list of options available are setup as both a Company and a User Setting.
User Setting: Wireframe List for Vitals Timeline Wireframe Summary
Company Setting: Wireframe List for Vitals Timeline Wireframe Summary
Save the Graph Layout
Once you have determined which items you would want turned on/off and graphed out together, you can save this graph layout so that it appears each time this window is opened.
- Configure the window to your liking by:
- Adding or removing vital items from the graph
- Adding or removing lab results from the graph
- Setting the time frame that you care about
- Deciding if you want to see All or Current Medications. And, if only Prescribed medications are displayed.
- Right click over the window
- Select Save Graph Layout
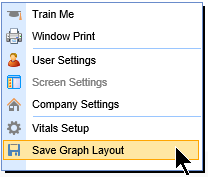

Table View
Users can switch to the Table View by clicking the toggle in the upper left hand corner of the window. The information displayed is the raw data representation of the same information shown in the Graph View. The settings described above will also control the Table View.
Access the Table View
To see the Table View, follow the below steps:
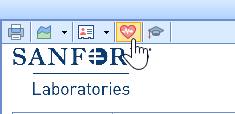
- click on the Vitals Clinical Marker icon
 anywhere you see it on the Timeline or when viewing a Lab Result to launch the data trends.
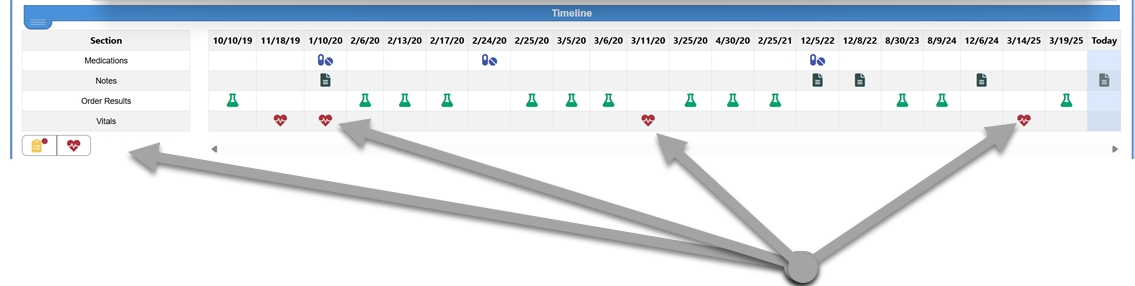
- Select the Table radio option in the upper left hand corner.
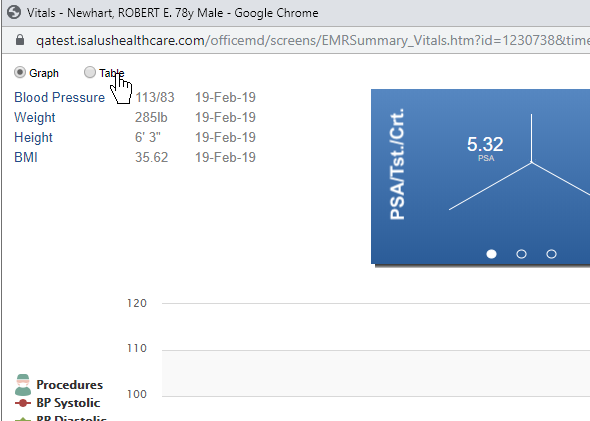
- The Table View is displayed.
 anywhere you see it on the Timeline or when viewing a Lab Result to launch the data trends.


