The New Billing Analytics, containing marked usability improvements from the original billing analytics package, allows user to develop custom financial reports based on fields and measures in the below data dictionary. The data is refreshed each night by 6am EST.
Once your practice has been set up to utilize this feature, you can download the connection file and get to work building new Billing Analytics reports. To do this, use the following steps:
- Create a folder where you would like to store your Analytics reports. In this example, it's a folder on the Desktop called 'Analytics.'
- In iSalus, navigate to Reports.
- Click Billing Analytics (Adv.) if you have both billing analytics models. Otherwise, click Billing Analytics.
- A pop up will appear prompting you to save the report – click the down arrow next to Save, and click Save as:

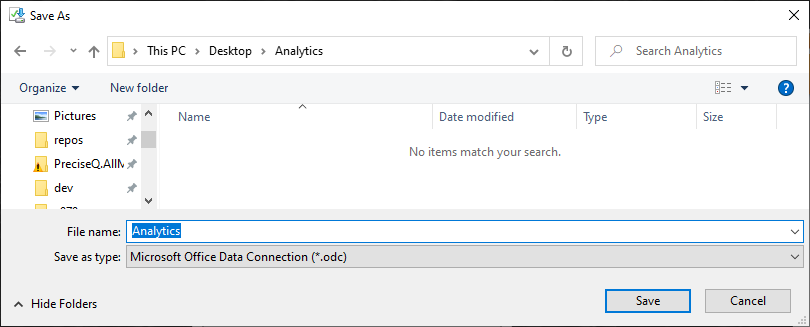
- In the resulting window, name your file whatever you would like your connection to be called in Excel, then save it to the folder you created in Step 1. In this example, it's called 'Analytics'.
- Navigate to the folder and open the saved file.
- If you receive the following warning, click Enable:

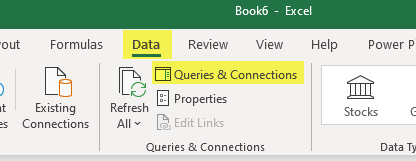
- The Excel worksheet will open with a Pivot Table already started. At the top of the screen, click Data, then Queries and Connections:
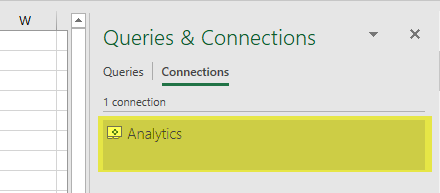
- You will see your saved file name as the name of the connection in the right-hand pane. Double-click this connection:
- In the Definition tab of the Connection Properties, ensure that the Always use connection file and Save password boxes are checked (clicking Yes for confirmation), and click OK:
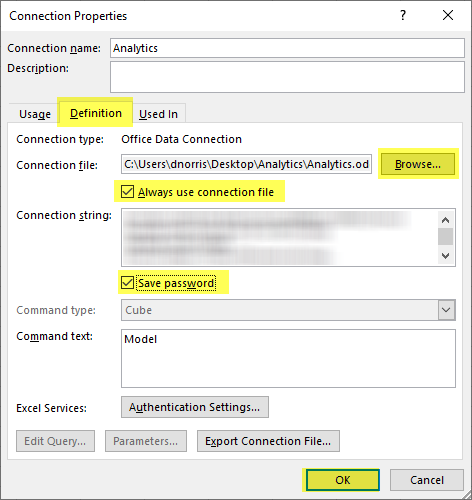
- At this point you can save your report, preferably in the same folder as the connection file. If you ever move the connection file, you may need to modify the Connection file property in the Connection Properties window shown above.
- Create a folder where you would like to store your Analytics reports. In this example, it's a folder on the Desktop called 'Analytics.'
- In iSalus, navigate to Reports.
- Click Billing Analytics (Adv.) if you have both billing analytics models. Otherwise, click Billing Analytics.
- A pop up will appear prompting you to save the report – click the down arrow next to Save, and click Save as:

- In the resulting window, name your file whatever you would like it to be called, then save it to the folder you created in Step 1. In this example, it's called 'Analytics'.
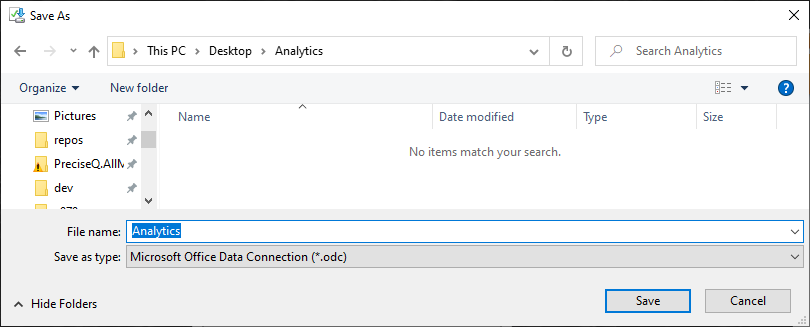
- Open the report that you’re wanting to connect to the cube on your own machine. At the top of the screen, click Data, then Queries and Connections:
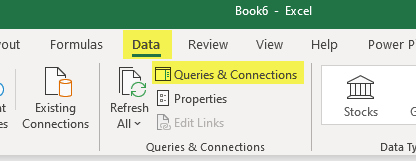
- You will see a connection in the right-hand pane. Double-click this connection:
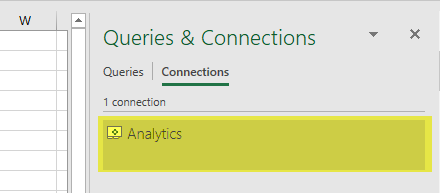
- In the Definition tab of the Connection Properties, use the Browse button to navigate to where you have saved your local connection file, and select it.
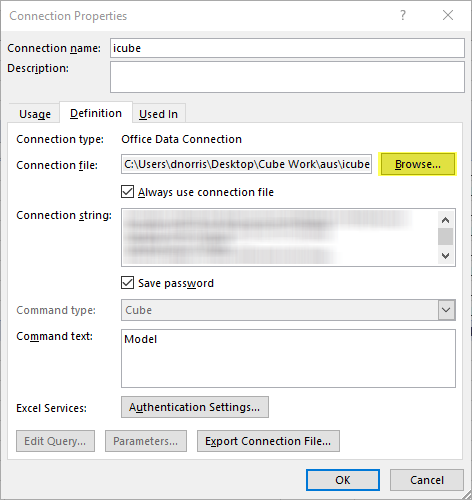
- Back in the Definition tab, ensure that the Always use connection file and Save password boxes are checked (clicking Yes for confirmation), and click OK:
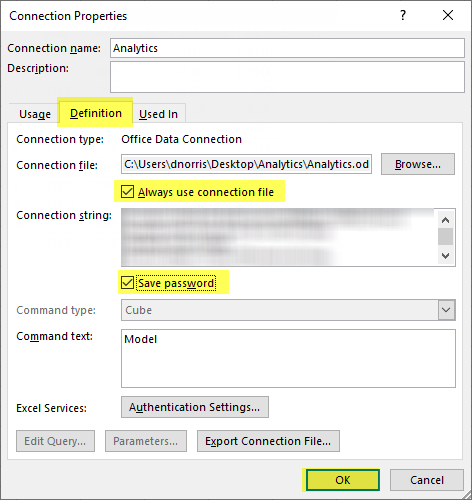
- At this point you can save your report, preferably in the same folder as the connection file. If you ever move the connection file, you may need to modify the Connection file property in the Connection Properties window shown above.
When you have completed a worksheet as desired in Billing Analytics and would like to create a new worksheet to add to your workbook, you have two options.
First, you can copy your current worksheet. This option is best if there are certain settings or fields that you would like to carry over, to save time when creating your new PivotTable. To do this, take the following steps:
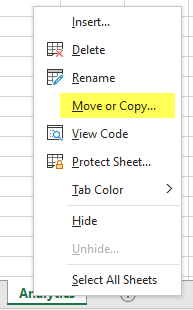
- Right-click the name of your worksheet at the bottom of the screen and select Move or Copy:
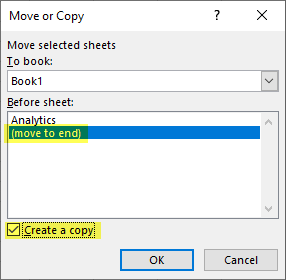
- In the window that opens, select (move to end) and Create a Copy:
- Double-click the name of the new worksheet to rename as desired, and modify the new worksheet and PivotTable as needed:

If instead you would like to start with a brand new worksheet and PivotTable, you can take the following steps:
- At the bottom of the screen, click the + icon to add a new worksheet:

- If desired, double-click the name of the new worksheet to rename.
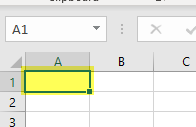
- Click the top left cell in the worksheet, if it's not already selected:
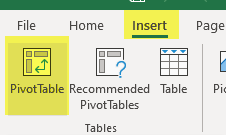
- At the top of the screen, select Insert, then PivotTable:
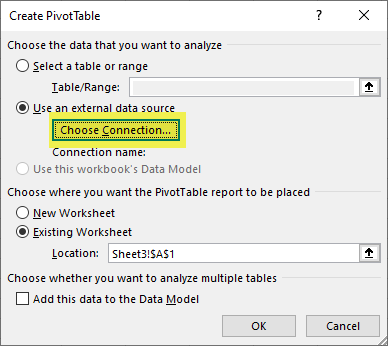
- On the resulting window, click Use an external data source, and click Choose Connection:
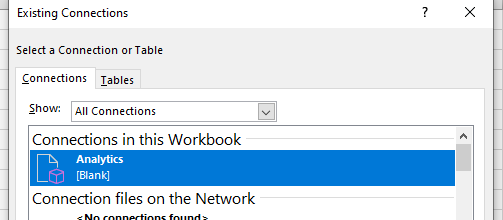
- Select your Connection, hit OK, and hit OK again:
- Add fields to your new PivotTable as desired.
In Billing Analytics, you have the option of adding a chart that connects to your practice's data. This chart can make use of all the same fields as PivotTables, and can even be connected with slicers. To add a chart, take the following steps:
- Navigate to the worksheet where you would like the chart to appear.
- At the top of the screen, select Insert, then Pivot Chart, then Pivot Chart. Note: If you would like to add a PivotChart and a PivotTable that displays the same data but in numerical format, you can instead select PivotChart & PivotTable.

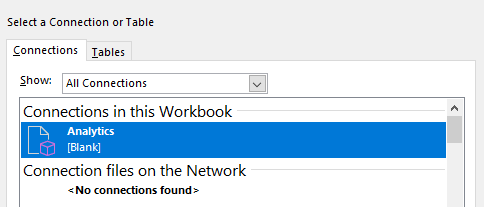
- Select Use an external data source, and select Choose Connection:
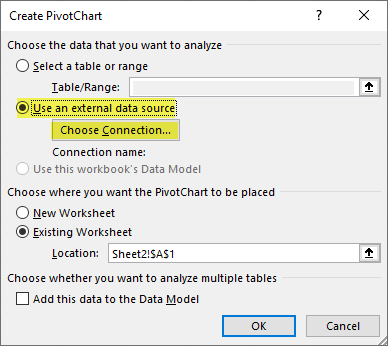
- In the resulting window, select your connection and hit OK, then hit OK again:
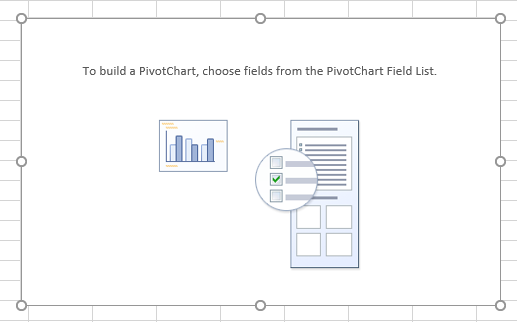
- You will see a blank PivotChart:
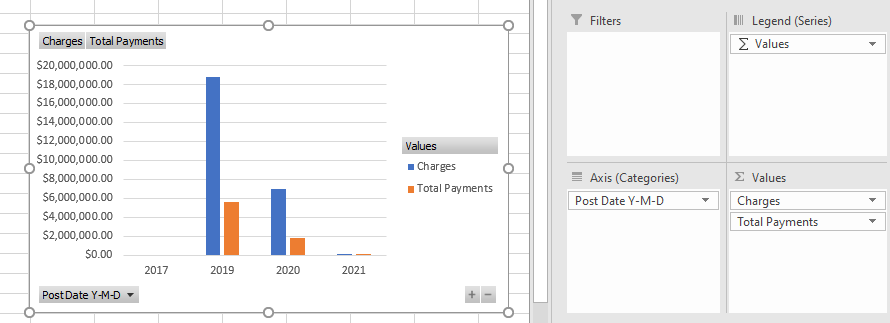
- You can build the chart just like a PivotTable, adding fields in the pane at the right to build your chart. For instance, here is a basic chart showing Charges and Payments by Post Date:
In a Billing Analytics workbook, users often need to change the filters for multiple pivot tables or charts at once -- most frequently when updating date ranges to a new value. Rather than add a date filter to each chart or table, it's more efficient to add a slicer that connects to each to perform the filter.
To add a slicer to your worksheet, perform the following steps:
- Decide where you'll want the slicer. Frequently I have a sheet at the beginning of my workbook where I can put all relevant slicers.
- On the Excel toolbar, select Insert, then Slicer:

- Select your Billing Analytics connection, and hit OK:
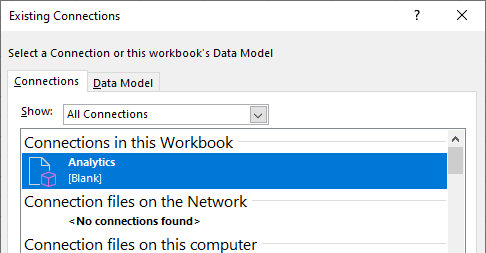
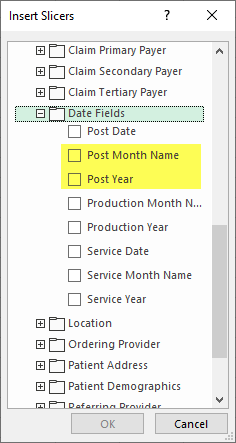
- Select the fields you want to slice, and hit OK. In this example, I want to slice on Post Year and Post Month (Note: If slicing on dates, we recommend using the fields under the Date Fields category rather than the hierarchies at the top of the list):
- This will bring up your slicers -- arrange them on the page as desired.
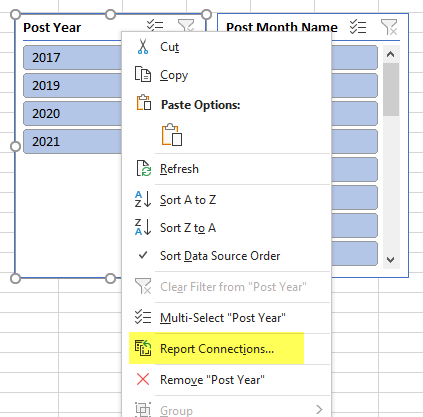
- Right-click on each slicer, and select Report Connections:
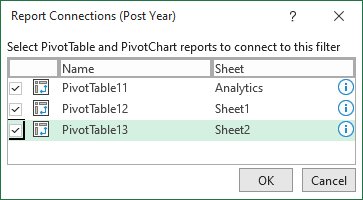
- Select all report items you'd like to connect the slicer to, and hit OK.
- If at any point you need to add additional PivotTables or PivotCharts, you can repeat steps 6 and 7 to connect them to the slicer.
Values
In Microsoft Excel, ‘Values’ are the actual numbers that you are able to analyze/report on. This type of data is quantitative (numerical). You will see the possible values at the top of the PivotTable Fields list as follows:

Here are the available values:
- Adjustments: The dollar amount of included adjustments.
- Balance: For a given line, this will reflect how it affected the balance. If reporting by Post Date, it will show a change in balances over a given period of time. If reporting by claim ID, it will show a summation of all changes in the claim’s balance, which will give the current total. If reporting by aging bucket or service date, you’ll see the current balances in that bucket, or balances for that service date range. Balance is calculated as Charges + Adjustments + Total Payments.
- Charge Units: The number of units of included charges.
- Charges: The dollar amount of included charges.
- Insurance Payments: The dollar amount of insurance payments.
- Patient Payments: The dollar amount of patient payments.
- Total Payments: The dollar amount of total payments (patient payments + insurance payments).
- Total RVU: The Total RVU amount of included charges (for each procedure code, the assigned RVU * Charge Units).
- Counts: A folder containing values relevant to charge counts.
- Charge Claim Count: The total number of claims that make up the included charges.
- Charge Line Count: The total number of charge lines that make up the included charges.
- Charge Patient Count: The total number of patients who have included charges.
Additional Fields
The other available fields are how you might analyze or break down a number. This type of data is qualitative, grouping and dividing values out into categories. All non-date fields are grouped into folders by category.
- Post Date Y-M-D: This allows a user to filter or group transactions based on their post dates. For instance, users may have this in the ‘Row’ group if they want to see financials by posting month.
- Post Year: The year value of the transaction’s post date.
- Post Month Name: The month name of the post date for the transaction.
- Post Day: The day of the transaction’s post date.
- Production Date Y-M-D: This allows a user to view their financials based on production date. When using Production Date, charges are filtered or grouped based on their dates of service, while payments are filtered or grouped based on the post dates.
- Production Year: For charges, this is the year value of the original date of service. For payments, this is the year of the transaction's post date.
- Production Month Name: For charges, this is the month name of the original date of service. For payments, this is the month name of the transaction's post date.
- Production Day: For charges, this is the day of the original date of service. For payments, this is the day of the transaction's post date.
- Service Date Y-M-D: This allows a user to filter or group transactions based on their service dates. Please note that payments will also be filtered or grouped based on originating service dates, regardless of when the payment was received. For instance, users may have this in the ‘Row’ group if they want to see financials by when the services were provided – if they want to review remaining balances for a given service date month, for instance.
- Service Year: The year value of the claim's service date.
- Service Month Name: The month name of the claim's service date.
- Service Day: The day of the claim's service date.
- Aging Information: Users can use the fields in this category to pull aging reports similar to the Aging Analysis in the system.
- Aging Bucket by Aging Date: This is the aging bucket for the relevant claim if calculating by Aging Date. If trying to produce a report similar to the Aging Analysis, this would be put in the ‘Column’ category.
- Aging Bucket by DOS: The aging bucket for the relevant claim if calculating by DOS. If trying to produce a report similar to the Aging Analysis, this would be put in the ‘Column’ category.
- Aging Financial Class: The insurance class for the relevant claim, calculated the same as it is on the Aging Analysis report – by selecting the highest claim level that has a corresponding send date populated on the claim.
- Aging Type: If the invoice date is populated on the claim, this is set to ‘Patient.’ Otherwise, if any insurance date is populated, it is set to ‘Insurance.’ Otherwise, self-pay claims and those missing primary payers are set to ‘Patient,’ and all others set to ‘Insurance.’
- Claim Has Responsible Party: If the claim has a responsible party set, this field will be set to ‘1’ – otherwise, it will be ‘0.’
Relevant Company Setting: Please note that there is a company setting relevant to the Billing Analytics aging buckets, Company Setting: Split A/R into two buckets in cube, 0-15 and 16-30. If set to 'Yes,' instead of the single 0-30 Day aging bucket, users will see their 0-30 Day aged receivables split into buckets for 0-15 Days and 16-30 Days.
- Alternate Provider: Fields related to the alternate provider on the claim.
- Alternate Provider Name: The full name of the alternate provider on the claim.
- Alternate Provider NPI: The NPI of the alternate provider on the claim.
- Alternate Provider Reverse Name: The alternate provider’s name in the format “[Last Name], [First Name]”.
- Attending Provider: Fields related to the attending provider on the claim.
- Attending Provider Name: The full name of the attending provider on the claim.
- Attending Provider NPI: The NPI of the attending provider on the claim.
- Attending Provider Reverse Name: The attending provider’s name in the format “[Last Name], [First Name]”.
- Claim Information: Fields related to general claim information.
- Claim Diagnoses: A list of all diagnoses found on this claim.
- Claim ID: The unique ID for this claim.
- Claim Level: The level of the claim—set to Primary, Secondary, Tertiary, Statement, or Completed.
- Claim Owner: The current user assigned as Owner on the claim.
- Claim Status: The current Claim Status.
- Claim Submission Type: The current Submission type for the claim, Electronic or Paper.
- Claim Substatus: The text description for the current Claim Substatus.
- Claim Type: The current Claim Type (Medical, Dental, EPSDT, DME, etc.) on the included claim(s). Note: Medical is the default Claim Type on all claims.
- Submission Status: Denotes whether the claim is Submitted or Unsubmitted. This is based on whether any invoice or insurance dates are populated.
- Claim Line Code: Information related to the procedure code on the claim line.
- Code: The procedure code on the claim line.
- Code Description: The description of the procedure code on the claim line, truncated to 30 characters.
- Code Description (Long): The full description of the procedure code on the claim line.
- Code Group: The Code Group for the procedure code on the claim line.
- Code NDC: The NDC for the procedure code o the claim line.
- Code with Description: Shows both the procedure code on the claim line and its short description.
- Claim Line Dx: Information related to the diagnosis codes on the claim line.
- Charge Line Dx List: A list of all diagnoses on the claim line, delimited by spaces.
- Charge Primary Dx: The primary diagnosis code on the claim line.
- Charge Primary Dx Description: The description of the primary diagnosis code on the claim line.
- Charge Primary Dx with Desc: The primary diagnosis code on the claim line with its description.
- Claim Line Modifiers: Information related to the modifiers on the claim line.
- Code Modifier 1: The first modifier on the claim line.
- Code Modifier 2: The second modifier on the claim line.
- Code Modifier 3: The third modifier on the claim line.
- Code Modifier 4: The fourth modifier on the claim line.
- Claim Primary Payer: The primary payer assigned to the relevant claim.
- Claim Primary Financial Class: The financial class of the claim’s primary payer.
- Claim Primary Payer ID: The Payer ID of the claim’s primary payer.
- Claim Primary Payer Name: The name of the claim’s primary payer.
- Claim Secondary Payer: The secondary payer assigned to the relevant claim.
- Claim Secondary Financial Class: The financial class of the claim’s secondary payer.
- Claim Secondary Payer ID: The Payer ID of the claim’s secondary payer.
- Claim Secondary Payer Name: The name of the claim’s secondary payer.
- Claim Tertiary Payer: The tertiary payer assigned to the relevant claim.
- Claim Tertiary Financial Class: The financial class of the claim’s tertiary payer.
- Claim Tertiary Payer ID: The Payer ID of the claim’s tertiary payer.
- Claim Tertiary Payer Name: The name of the claim’s tertiary payer.
- Date Fields: Additional date fields available if needed to add in any of the field sections of the report.
- Post Date: The post date of the transaction, whether charge, adjustment, or payment.
- Post Month Name: The month name of the post date for this transaction.
- Post Year: The year of the post date for this transaction.
- Production Month Name: The month name of the production date for this transaction. For charges, this will be the service date. For payments and adjustments, this is the post date.
- Production Year: The year of the production date for this transaction. For charges, this will be the service date. For payments and adjustments, this is the post date.
- Service Date: The service date of the claim.
- Service Month Name: The month name of the service date on the claim.
- Service Year: the year of the service date on the claim.
- Location: Fields related to location, whether patient location, service location, or business unit.
- Business Unit: The business unit allocation for this claim.
- Patient Location: The Patient Location currently on the claim.
- Patient Location ID: The system ID of the Patient Location currently on the claim.
- Patient Location Tax ID: The tax ID of the Patient Location currently on the claim.
- Service Location: The Service Location currently on the claim.
- Service Location ID: The system ID of the Service Location currently on the claim.
- Service Location State: The state that the Service Location on the claim is located in.
- Service Location Tax ID: The tax ID of the Service Location currently on the claim.
- Service Location Zip Code: The zip code that the Service Location on the claim is located in.
- Business Unit: The business unit allocation for this claim.
- Ordering Provider: Fields related to the ordering provider on the claim.
- Ordering Provider Name: The full name of the ordering provider on the claim.
- Ordering Provider NPI: The NPI of the ordering provider on the claim.
- Ordering Provider Reverse Name: The ordering provider’s name in the format “[Last Name], [First Name]”.
- Patient Address: The fields that comprise the address of the patient on the claim.
- Patient Address 1: Line 1 of the patient’s address.
- Patient Address 2: Line 2 of the patient’s address.
- Patient City: The patient’s city.
- Patient State: The patient’s state.
- Patient Zip: The patient’s zip code. .
- Patient Demographics: Information relevant to the patient on the claim.
- Patient DOB: The patient’s date of birth.
- Patient Email: The patient’s email address.
- Patient External ID: The ‘Old ID #1’ from the patient’s demographics.
- Patient First Name: The patient’s first name.
- Patient Gender: The patient’s gender.
- Patient ID: The patient's chart number.
- Patient is Active: ‘1’ if the patient is active, ‘0’ if the patient has been made inactive.
- Patient is Living: ‘1’ if the patient is living, ‘0’ if the patient is deceased.
- Patient Last Name: The last name of the patient.
- Patient Middle Name: The middle name of the patient.
- Patient Name: The patient’s full name.
- Patient Name Suffix: The suffix at the end of the patient’s name.
- Patient Nickname: The ‘Nick’ from the patient’s demographics.
- Patient Reverse Name: The patient’s name in the format “[Last Name], [First Name]”.
- Referring Provider: Fields related to the referring provider on the claim.
- Referring Provider Name: The full name of the referring provider on the claim.
- Referring Provider NPI: The NPI of the referring provider on the claim.
- Referring Provider Reverse Name: The referring provider’s name in the format “[Last Name], [First Name]”.
- Rendering Provider: Fields related to the rendering provider on the claim.
- Rendering Provider First Name: The first name of the rendering provider on the claim.
- Rendering Provider Last Name: The last name of the rendering provider on the claim.
- Rendering Provider Middle Name: The middle name of the rendering provider on the claim.
- Rendering Provider Name: The full name of the rendering provider on the claim.
- Rendering Provider Name Suffix: The suffix of the claim rendering provider’s name.
- Rendering Provider NPI: The NPI of the rendering provider on the claim.
- Rendering Provider Reverse Name: The rendering provider’s name in the format “[Last Name], [First Name]”.
- Supervising Provider: Fields related to the supervising provider on the claim.
- Supervising Provider Name: The full name of the supervising provider on the claim.
- Supervising Provider NPI: The NPI of the supervising provider on the claim.
- Supervising Provider Reverse Name: The supervising provider’s name in the format “[Last Name], [First Name]”.
- Transaction Information: Fields related to a payment. Please note that these fields will be empty for all charges.
- Paid By: The name of the entity that made the payment or adjustment.
- Paid By Financial Class: If the ‘Paid By’ value is a payer, this field is the relevant payer’s financial class.
- Payment Method: The payment method of the payment or adjustment.
- Payment Type: The payment type of the payment or adjustment.
The new Billing Analytics package has a pre-defined set of fields that will be displayed when drilling through into detail for most measures. When looking at a table of data, any number can be double-clicked to drill through into the detail for that cell:

This will bring up an additional sheet in the same Excel workbook with the following fields:
- Patient ID: The patient's chart number.
- Patient Reverse Name: The patient’s name in the format “[Last Name], [First Name]”.
- Rendering Provider Reverse Name: The rendering provider’s name in the format “[Last Name], [First Name]”.
- Service Location: The Service Location currently on the claim.
- Service Date: The Service Date of the associated claim.
- Post Date: The Post Date of the associated transaction, whether it's a charge, payment, or adjustment.
- Claim ID: The unique ID for this claim.
- Claim Status: The current Claim Status.
- Code Group: The Code Group for the procedure code on the claim line.
- Code: The procedure code on the claim line.
- Charge Primary Dx: The primary diagnosis code on the claim line.
- Payment Method: The payment method, if transaction is a payment or adjustment.
- Charges: If the detail line represents a charge, this is the associated dollar amount.
- Insurance Payments: If the detail line represents an insurance payment, this is the associated dollar amount.
- Patient Payments: If the detail line represents a patient payment, this is the associated dollar amount.
- Total Payments: If the detail line represents any payment, this is the associated dollar amount.
- Adjustments: If the detail line represents an adjustment, this is the associated dollar amount.
Here are a few examples of reports that can be created with the new Billing Analytics.
Financials by Insurance Class for DOS Month
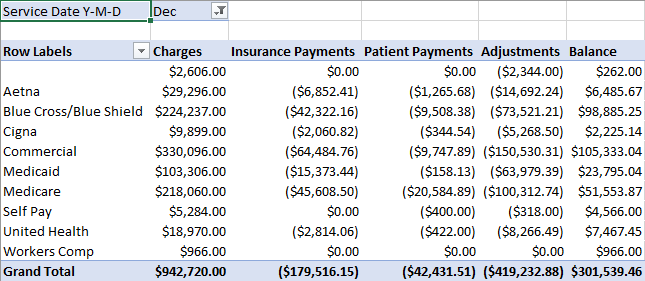
This report shows Charges, Payments, Adjustments, and remaining Balances for everything with a DOS month in December, grouped by Insurance Class.
- First, drag the desired fields to the PivotTable areas. Please note that 'Values' is not a field that you need to add to the Columns area -- it's automatically populated if more than one measure is added to the Values section, to denote that you'll have columns associated with each value.
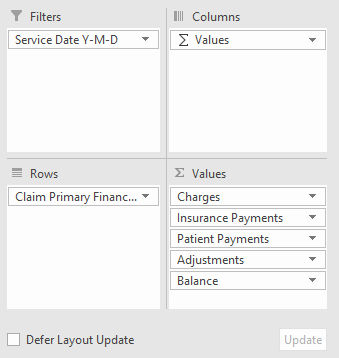
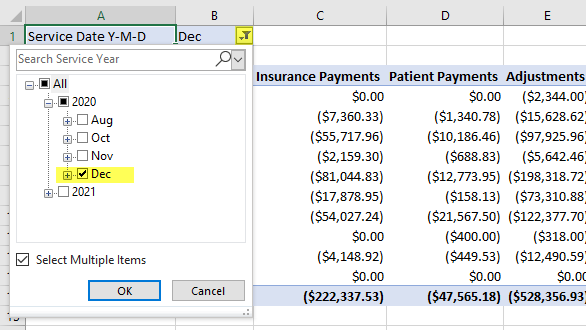
- Next, apply the desired service date filter by clicking on the filter icon where the filter is listed at the top of the report:
- You can now see the desired output, filtered to the desired date of service month:
Total Payments by CPT Group Over Time
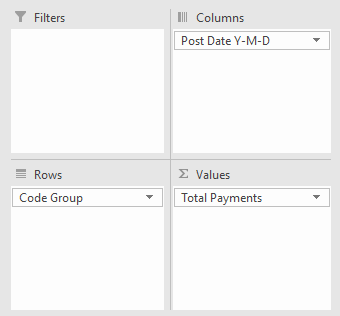
- First, drag the desired fields to the PivotTable areas:
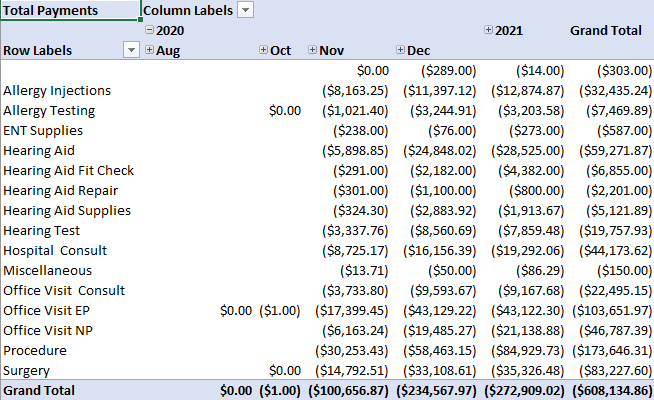
- You can now see the desired output, payments by CPT Group over time. The years in the column headers can be expanded with the (+) icons to view information for months and days.
MTD Charges, Payments, and Adjustments
- First, drag the desired fields to the PivotTable areas. Please note that 'Values' is not a field that you need to add to the Columns area -- it's automatically populated if more than one measure is added to the Values section, to denote that you'll have columns associated with each value.
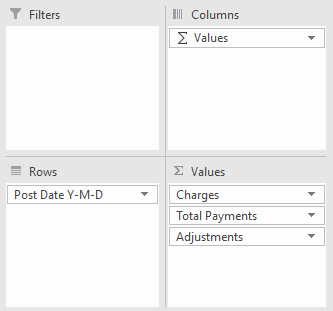
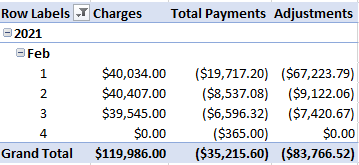
- You can now see the desired output, MTD Charges, Payments, and Adjustments. Please note that if you ever want to hide a component of the date field (the year, for instance, in the example below), you can right-click the year, go to 'Show/Hide Fields,' and uncheck the year field.
Refund Report
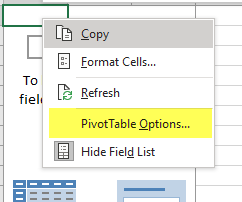
- First, we'll change the format of our PivotTable. Right-click on the table and select PivotTable Options:
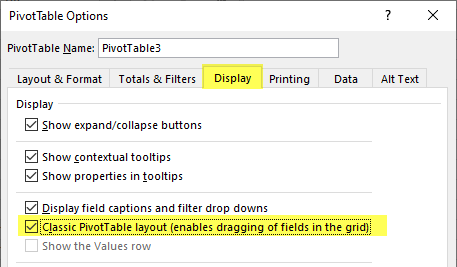
- On the Display tab, select the Classic PivotTable layout, and hit OK:
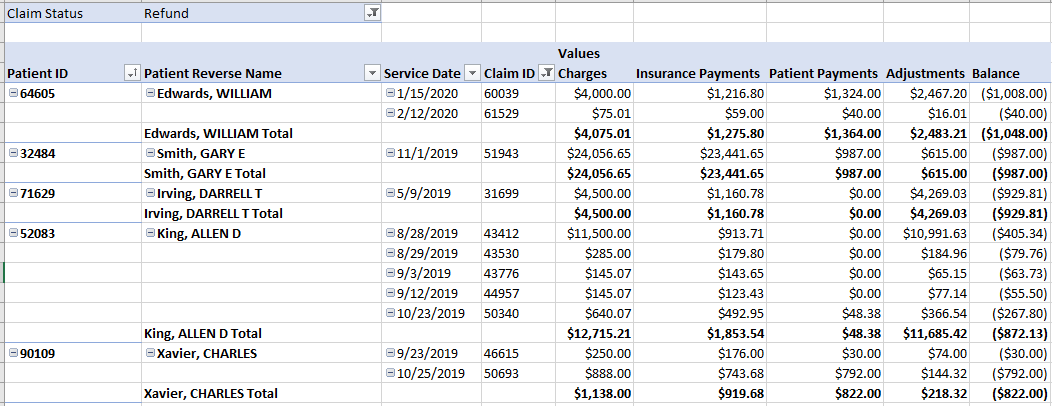
- Drag the desired fields to the PivotTable areas. Claim Status, Service Date, and Claim ID can be found in the Claim Information folder, Patient ID and Patient Reverse name are in Patient Demographics, and all the values are in the measures at the top of the window. Please note that 'Values' is not a field that you need to add to the Columns area -- it's automatically populated if more than one measure is added to the Values section, to denote that you'll have columns associated with each value.
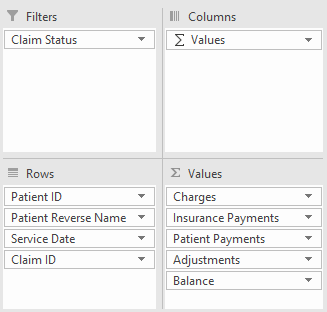
- Next, apply the desired Claim Status filter by clicking on the filter icon where the filter is listed at the top of the report:
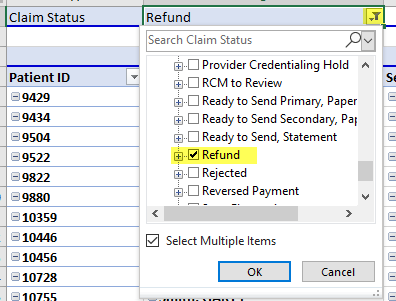
- If you see zero balance or actual balance claims on this list, you can go into the system and correct them. However, if you'd like to exclude claims where the balance is zero (or greater than zero), you can apply a value filter. Select the drop-down next to Claim ID, select Value Filter, and choose the relevant comparison:
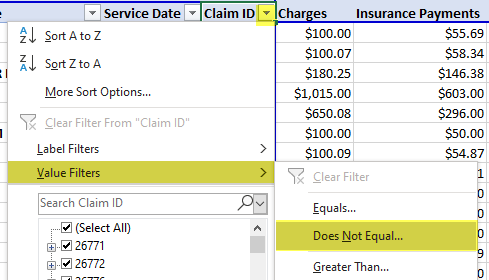
Enter the desired logic, and hit OK:
- If you would like to order patients from largest credit balance to least, click the drop-down beside the Patient ID, and select More Sort Options:
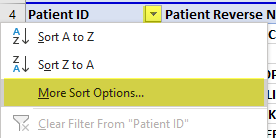
Choose Ascending by and Balance, and select OK: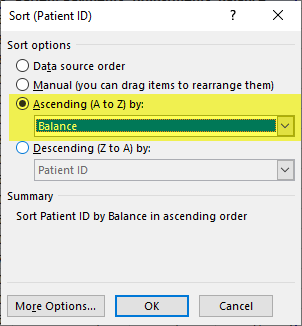
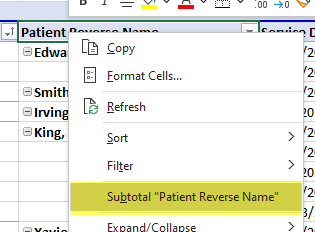
- If desired, you can sub-total by patient. Right-click on the column header Patient Reverse Name, and click Subtotal "Patient Reverse Name":
- You can now see a list of your Refund status claims, grouped by patient and ordered by the patient with the highest total credit:
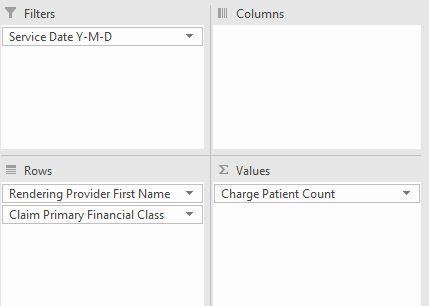
Distinct Patients Seen in DOS Month, by Rendering Provider by Insurance Class
- First, drag the desired fields to the PivotTable areas.
- Next, apply the desired service date filter by clicking on the filter icon where the filter is listed at the top of the report:
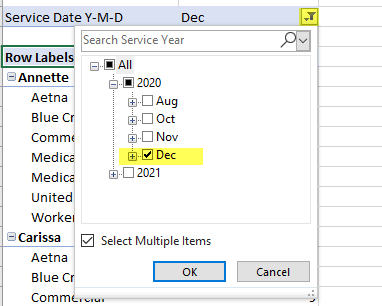
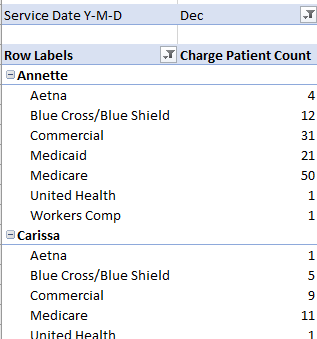
- You can now see the desired output, Distinct Patients Seen in DOS Month by Rendering Provider by Insurance Class:
Here is an example dashboard that can be built with the new Billing Analytics package. With slicers connected to the below, it's easy to see each of these charts filtered to only a subset of rendering providers, CPT groups, and locations.


By default, when creating new Pivot Tables in Excel, the table is formatted with the 'Compact' report layout.
However, there are multiple layouts available that can assist in producing functional and readable Pivot Tables.
To access the report layout option, in the toolbar select the Design tab:

With the Pivot Table selected, you can click the Report Layout drop-down to select other layouts.
You can select from the following layout options:
- Compact. This is the default layout in Excel Pivot Tables. It puts all row fields in a single column, moving to the next row for the next field. This makes the table more compact, but can be confusing when adding a large set of row fields:
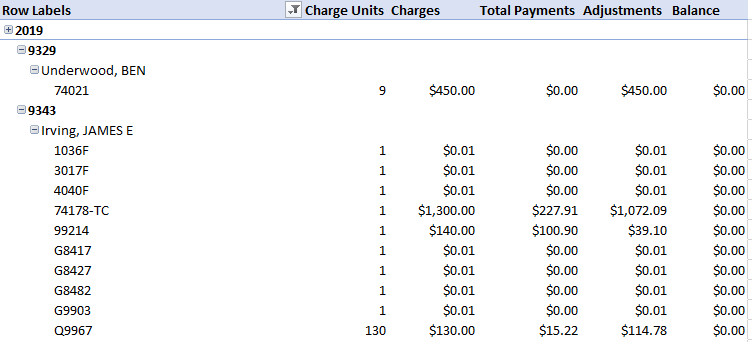
- Outline form. This layout has each row field in a separate column, but still moves to the next row for each row field underneath. It's a mix of the Compact and Tabular layouts.
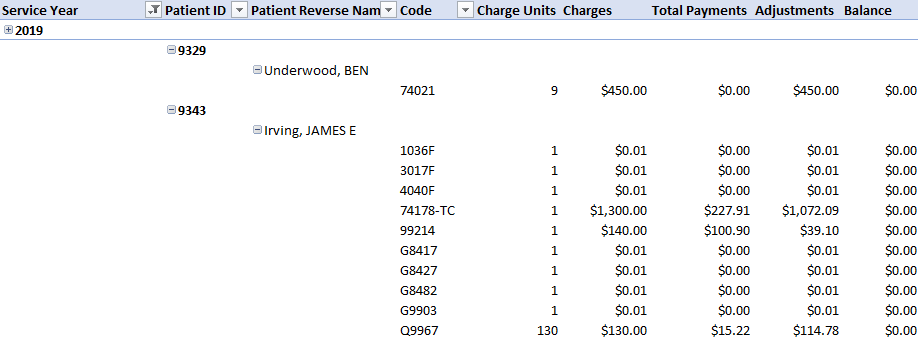
- Tabular form. This layout puts the Pivot information in a more standard table.

By default, when creating new Pivot Tables in Excel, the table has a mostly white design.
However, there are multiple color designs available that can assist in producing functional and readable Pivot Tables.
To access the report layout option, in the toolbar select the Design tab:

With the Pivot Table selected, you can click any of the Style images shown to modify the design. You can use the arrows to the right of the Styles to look through all additional options.
Here's an example of the base style versus additional options, viewing a report by service date of patient claims with procedure codes:
Default
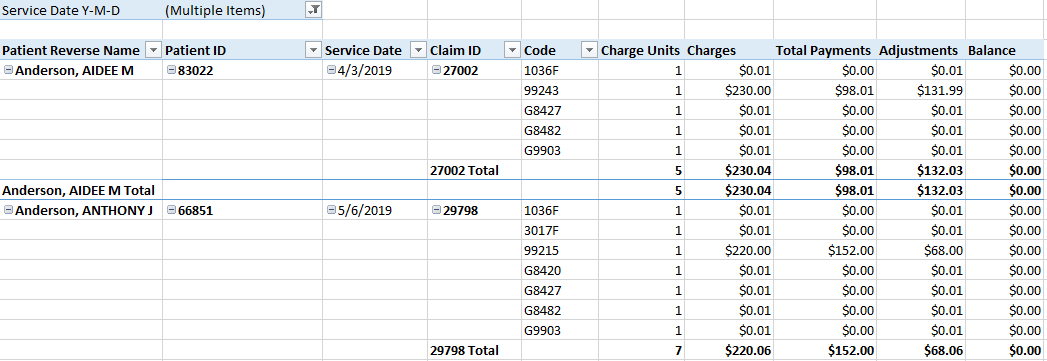
Sample Style

It's possible to connect Power BI Desktop with an existing New Billing Analytics cube. This will require the following steps:
- Look in Building a New Report with New Billing Analytics to see how to open a new billing analytics file in Excel, if you haven't already done so.
- In your Excel report connected to the new Billing Analytics, at the top of the screen, click Data, then Queries and Connections:
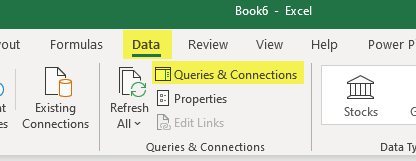
- You will see your connection in the right-hand pane. Double-click this connection:
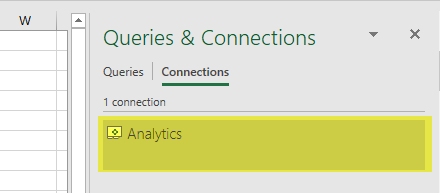
- In the Definition tab of the Connection Properties, ensure that the Save password box is checked (clicking Yes for confirmation). Then examine what's in the Connection string box, copying the Password (including any special characters) and DB information for later use:

- Start a new file in Power BI Desktop.
- Select the Get Data drop-down, then Analysis Services:
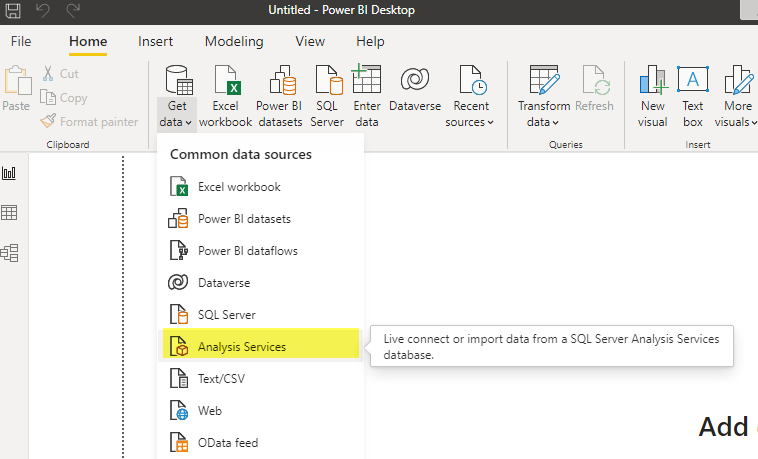
- Enter the following server information, enter the DB value from step 4 in the database field, and select Import. Then click OK.
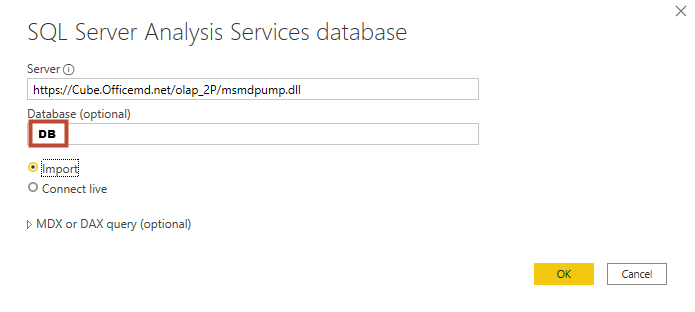
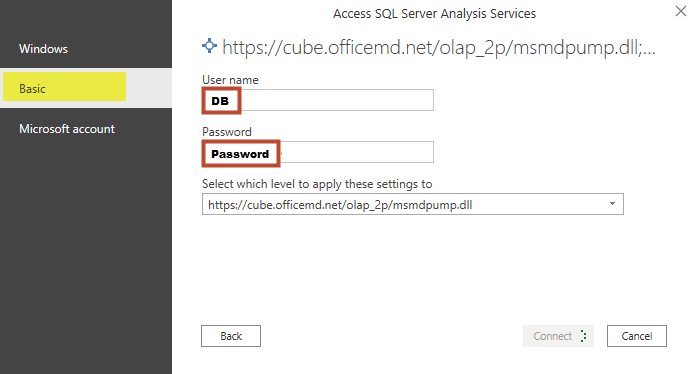
- Select Basic authentication, and enter the DB and Password from step 4. Then click Connect:
- In the Navigator, expand Model, Model, and report_transform. Then select the Measures and Fields you'd like to pull into Power BI. Note that memory limitations will mean that most sites will only be able to pull in a relevant subset of data. When ready, hit Load.
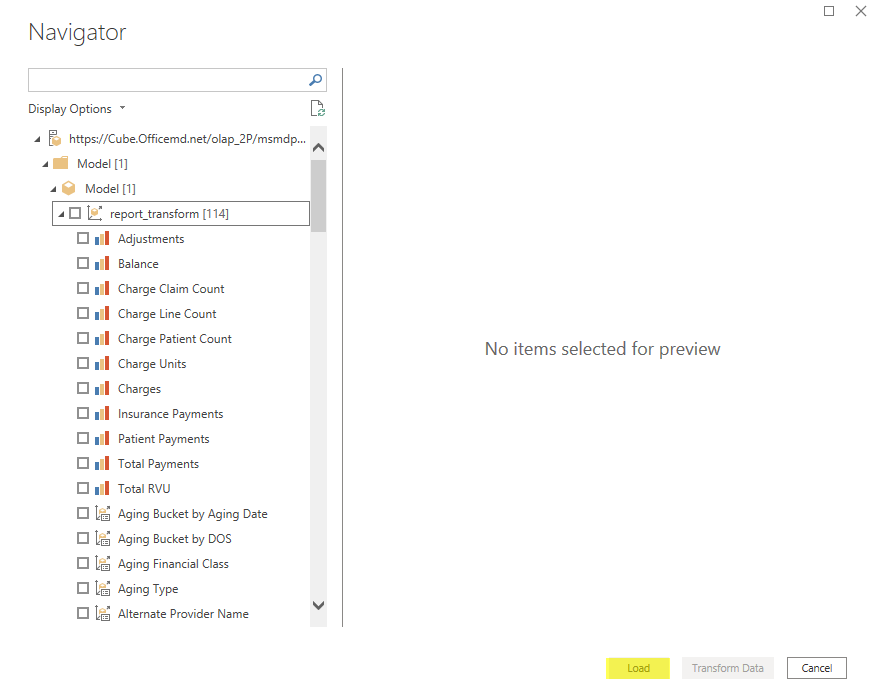
- Your selected data should now be available to use in creating Power BI reports.


