One advantage of the new payment posting module is that we can now capture reason code information on ERAs and manual EOBs. We have created a report that practices can use to analyze this CARC/denial data in aggregate.
- Open the Billing Portal in the lower left corner.

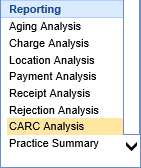
- In the left-hand navigation pane, choose the CARC Analysis from the Reporting section.


- Period: Users will enter a date range here for the search.
- Date Type: Provides users a choice of three different dates to pull data by:
- Deposit: This is the deposit date of the deposit in question.
- Posted: The post date of the deposit claim.
- Service: The service date of the claim.
- Posted Type: Allows users to select whether to see only posted deposit claims, only new ones, or both.
- Location Type: This allows users to select whether they’re interested in filtering service or patient location.
- Denied Type: This denotes whether the report will be looking at only denial information, or all CARC codes. By default, this report will only look at CARCs where the Denial box has been checked.
- Report Level: Here users select the main grouping for the report – whether you want to see the data returned grouped by date, location, financial class, code class, payer, procedure, provider, or CARC.
- Additional filters: This works like many other filters in the system, allowing users to filter down to certain financial classes, service locations, providers, and code classes. The only difference here is that users can also choose to only enter certain CARC codes if desired (for instance, if they want to look at information for only a particular denial).
The results for this report show the following fields:
- Grouping: The values of the grouping you selected for your Report Level.
- Amount: The total amount coming in for the relevant CARCs.
- Count: The number of times the relevant CARCs were posted.
- Claim Count: The number of distinct claims that had the relevant CARCs posted on them.
- Total Claims: The total number of distinct claims that had any ERA/EOB posted on them. If you’ve grouped by Financial Class, for instance, it will show you total claims only for that financial class. If you’ve grouped by CARC, it’s just the total amount of distinct claims with deposit claims over the selected time period.
- CARC %: This is the ratio of Claim Count to Total Claims. If Denied Type is ‘Yes,’ this is your denial percentage—i.e., how many of the claims we received ERAs/EOBs for over this time period received denials? If grouping by CARC, it shows what percentage of total claims had each respective CARC on them.
Here’s an example of running this data grouped by CARC:

And here’s an example of this same information when instead grouping by posting month (note that because I have only denials selected, this is showing me the percentage of distinct claims coming in that had denial CARCs on them):

If you right-click any of these lines, you can see extensive detail. Most fields are straightforward, but please note that Amount is the amount of this denial, and Balance is the total claim balance for this claim.
If viewing in the window, you can link directly to relevant deposits and claims – but we recommend exporting to Excel for further analysis.


