The following guide is an overview of the EMR Portal. Users will gain knowledge of the different areas of the EMR portal including setup and some additional helpful tips
To access the EMR, begin by selecting the EMR portal the bottom, left-hand corner of your screen.

Tip: Users can set the EMR as their default screen when logging in to the program by modifying their Default Screen in the User Setup.
Selecting a Schedule
- To view patients on a resource or multiple schedules, click on the pencil to display a list of resources. Select the Pencil Icon to reveal the resource(s) schedule(s). Select the Resources in order to display the appointments scheduled with that Resource.

2. The list of appointments will display in the Office Schedule.

Appointment Display Options
- Select preferences for what is displayed in the Patient List with the various display options.

Open Patient in EMR
- From the scheduled appointment, select the patient from the schedule. The lime green side bar to the left of the appointment indicates the patient’s chart is currently open.

NOTE: Always open scheduled patients in the EMR from the appointment list. Searching for the patient will not link back to the scheduled appointment for the required SOAP Note or Superbill.
2. To open a patient’s chart that is not on the schedule, search for the patient in the top, right corner of the EMR portal.

Menu Bar
The menu bar across the top of the EMR portal has additional options for navigating and performing tasks in the patient's chart.
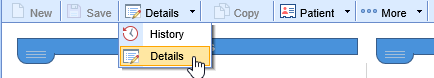
Details/History
Toggle between the Timeline Details and History view
Patient Index/Drop down options
Click on icon to open Patient Index or use the drop down for additional menu options

More menu
Print the Patient Facesheet

Patient Display
The patient’s name, DOB and Gender display on the top right of the screen. Simply hover over the name for additional demographic information.

Top Section
Displays Allergies, Medications, Problems and Encounters
- Drop downs
Utilize drop down for Allergies, Medications and Problems to open chart tab or mark as reviewed

- Encounter hyperlink
Double click on encounters to open the appointment list

Clinical Messages
Clinical messages display in this section based on rules/setup

Timeline
The Timeline within the Summary chart tab allows a user to see key data points that have been added to a patient's chart over time. Each clinical marker can be hovered over to see basic information about that new chart time. Once clicked, more details are displayed.

- Hover to display details

- Clipboard
The Clipboard at the bottom left of the Timeline allows users to Reconcile Allergies, Medications and Problems. Keep or Remove items then click Save

- Vitals
To view Vitals Graph/Table, click on the Heart symbol at the bottom left of the timeline

Patient Photograph/Telehealth
This section displays the Patient Photograph. You can also launch a Telehealth session if enrolled.

Patient AMP
The Patient AMP is a quick view of Allergies, Medications, Problems, Vitals and Results

Chart Tabs
Chart Tabs contain templates to document a patient encounter. The list can be customized (see Customize View section) for instructions.

Quick Picks
The Quick Picks tool allows a user to set up custom phrases that can be copy/pasted into any template.

E/M Coding
The E/M Coding optional tool allows a user to calculate E/M code based on new 2021 rules based on MDM (Medical Decision Making) or Time.

Customize View
- Top Section, Timeline and/or Other section view, right click anywhere on the Timeline

Mark or unmark each item you want to view. You can also order each section by moving the up/down arrows

- Chart Tab/AMP view, right click in the Chart Tab area, select Setup Favorites

Select Chart tabs to view as well as select order they display with the up/down arrows, then click Save

- Setup Sections
Right click in the Patient Photograph or Patient AMP area to display Setup Sections option – mark each area to enable and/or display expanded, then click Save

