Here are some sample reports that you can produce with Billing Analytics:
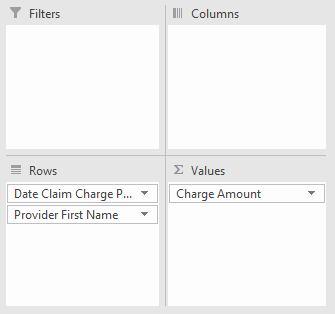
Charges by Month by Rendering Provider:
- First, drag the desired fields to the PivotTable areas:
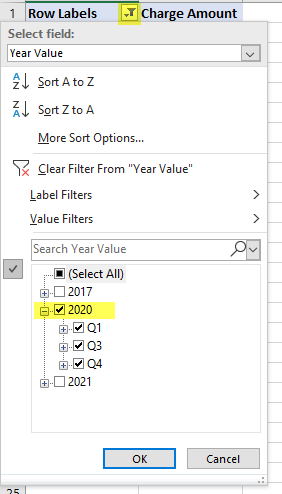
- Next, apply the desired service date filter by clicking on the filter icon where the filter is listed at the top of the report:
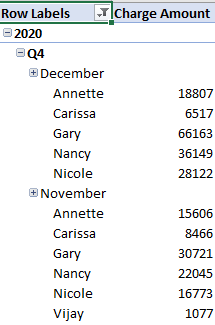
- You can now see the desired output, charges by month by rendering provider filtered to the desired date range:


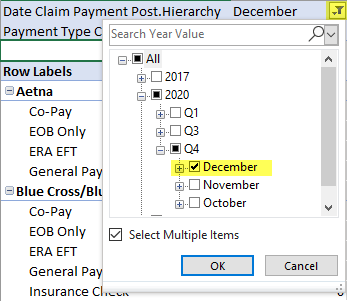
Payments by Financial Class by Payment Type for Post Date Range
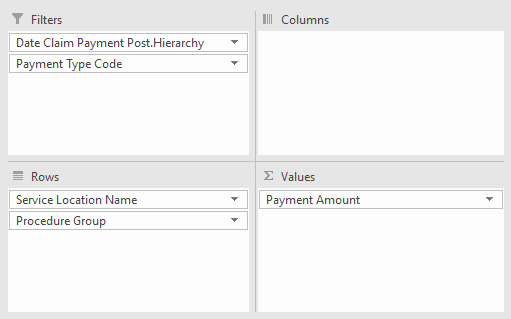
- First, drag the desired fields to the PivotTable areas:
- Next, apply the desired service date filter by clicking on the filter icon where the filter is listed at the top of the report:
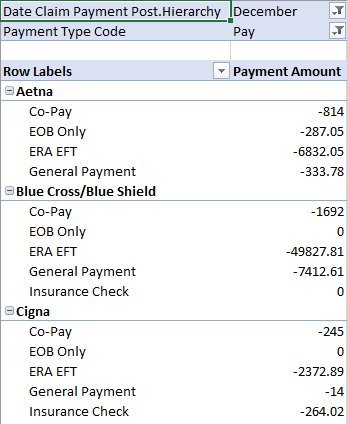
- You can now see the payments by financial class by payment type, filtered to the desired posting date range:


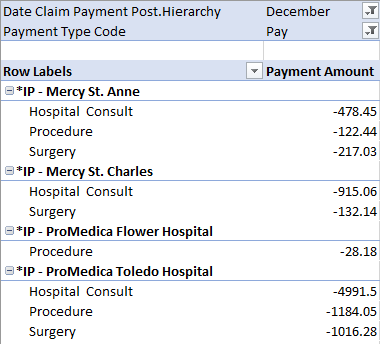
Payments by Location by CPT Group
- First, drag the desired fields to the PivotTable areas:
- Next, apply the desired service date filter by clicking on the filter icon where the filter is listed at the top of the report:
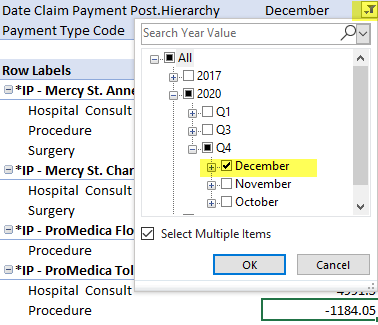
- You can now see the payments by location by CPT Group, filtered to the desired posting date range: